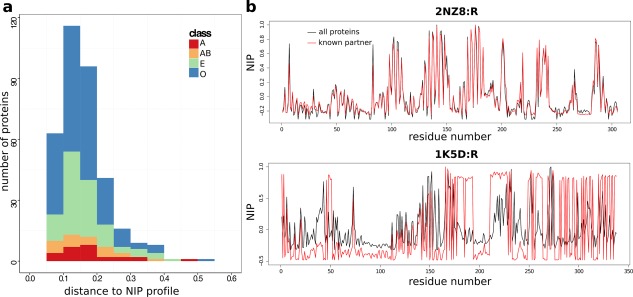
Figure 7.

Properties of the docking conformations. (a) Distribution of distances computed between the NIP profiles obtained from docking known partners and those obtained from docking all proteins. (b) NIP profiles computed from docking Rac GTPase (2NZ8:R) and Ran GTPase (1K5D:R) to all the proteins from PPDBv4 (black curves) or only their known partners (red curves). The distance between the two profiles is 0.06 for Rac GTPase and 0.37 for Ran GTPase.
