
Figure 5. IL-17C supports aortic chemokine expression and supports the recruitment of IL-17A+ Th17 cells to the aorta.
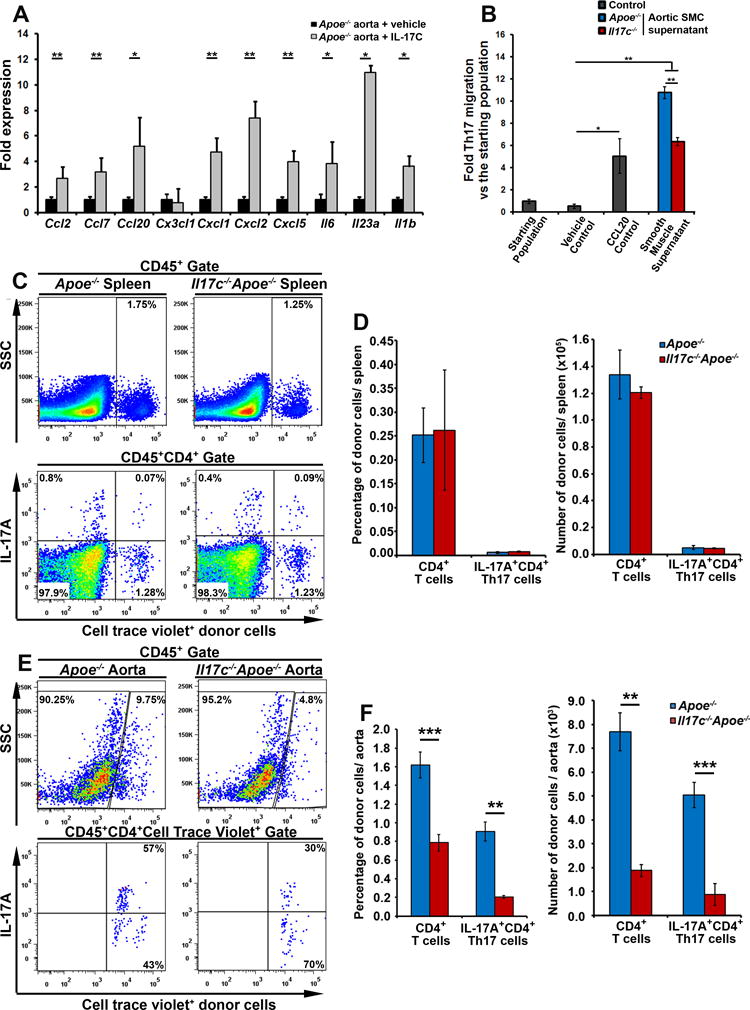
A) 12 week WD Apoe−/− aortas were sterilely explanted and untreated (black bars) or cultured with 100 ng/ml IL-17C (grey bars) for 24 hours before being collected and processed for RT-PCR. Fold induction of Ccl2, Ccl7, Cxc3cl1, Cxcl1, Cxcl2, Cxcl5, Ccl20, Il6, Il23a, and Il1b expression. n=9 Apoe−/− mice, 3 independent experiments. (B) 12 week WD-fed Apoe−/− and Il17c−/−Apoe−/− aortic smooth muscle cells (CD45−CD31−CD29− aortic cells) were sterilely FACS sorted and cultured for an hour in vitro to collect cell supernatants. CD4+ T cells were isolated in parallel from 40 week CD Il17aicre/icre R26RtdTomato/tdTomato Apoe−/− mice. Il17aicre/icreR26RtdTomato/tdTomatoApoe−/− CD4+ T cells migrated towards either a migration media (vehicle control), or 1000 ng/ml rCCL20, or Apoe−/− or Il17c−/−Apoe−/− aortic smooth muscle cell supernatants for 2 hrs. The transmigrated cells were collected and assessed for IL-17AtdTomato+ Th17 cells by flow cytometry and normalized to the percentage of Th17 cells in the starting population. n= 5 independent experiments, all assays were performed in triplicate. (C–F) 30×106 12 week WD Apoe−/− splenocytes were labeled with cell trace violet (CTV) and adoptively transferred to 12 week WD Apoe−/− and Il17c−/−Apoe−/− mice for 72 hours. The migration of CTV+CD4+ T cells, and CTV+ Th17 cells within the recipients was assessed by flow cytometry. Representative flow cytometry plots for CTV+ splenocytes, and CD4+ Th17 cell migration to recipient spleens (C) and aortas (E) are shown. Quantification of the percentage and number of donor CD4+ T cells and Th17 cells within the spleens (D) and aortas (F) of recipient 12 week WD Apoe−/− (blue) and Il17c−/−Apoe−/− (red) recipients. n= 5 recipients/genotype, 4 independent experiments. Bars depict means±SEM. * - p<0.05, ** - p<0.01, *** - p<0.001.