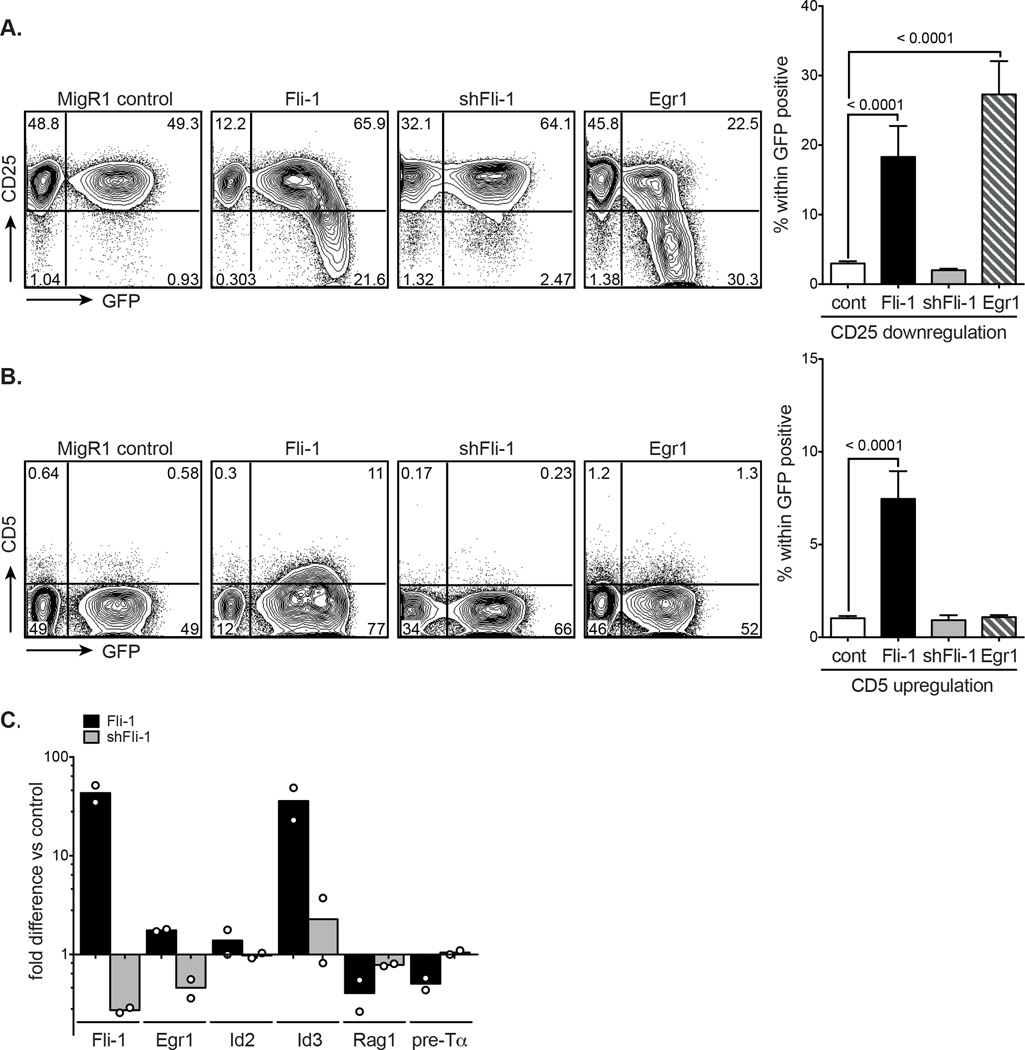
Figure 2. Effects of Fli-1 overexpression on pre-TCR signalling in Scid.adh cells.
MigR1 control, Fli-1, shRNA Fli-1 and Egr1-transduced Scid.adh cells were analysed for CD25 and CD5 expression by flow cytometry, 42 hours after transduction. Graphs show percentage (A) CD25 downregulation or (B) CD5 upregulation in GFP+ Scid.adh cells and data are shown as mean + SEM of ≥ 7 independent experiments, each comprised of a single sample per group. p values in A and B were determined by unpaired two-tailed student’s t-tests. (C) mRNA expression of Fli-1, Egr1, Id2, Id3, Rag1 and pre-Tα was determined by quantitative real-time PCR in sorted GFP+ Fli-1 and shRNA Fli-1-transduced Scid.adh cells at 42 hours post-transduction. Expression levels are shown as the mean fold difference versus sorted GFP+ control. Circles represent independent experiments; n = 2, each comprised of a single sample per group.

