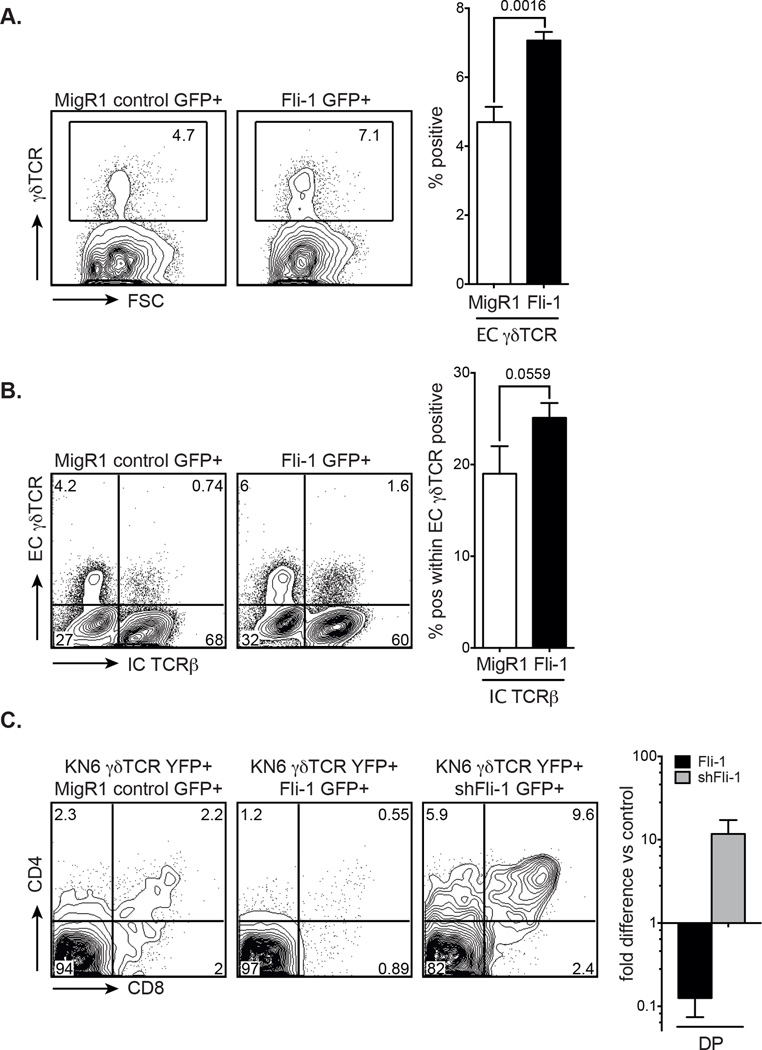
Figure 3. Effects of Fli-1 overexpression and Fli-1 knockdown on in vitro γδ versus αβ T-cell development.
(A) GFP+-gated γδTCR expression in MigR1 control and Fli-1-transduced FL cells determined by flow cytometry 12 days after transduction. Flow cytometry plots are representative of 5 independent experiments. Graphed data are shown as mean + SEM of 5 independent experiments, each comprised of a single sample per group. p value as indicated. Unpaired two-tailed student’s t-test. (B) Extracellular γδTCR and intracellular TCRβ expression in MigR1 and Fli-1-transduced FL cells determined by flow cytometry, 6 days after GFP+ DN3 cells were sorted by flow cytometry. Flow cytometry plots are representative of 5 independent experiments. Graphed data are shown as mean + SEM of 5 independent experiments, each comprised of a single sample per group. p value as indicated. Unpaired one-tailed student’s t-test. (C) Representative flow cytometry plots (5 independent experiments) of DP development in Rag-1−/− cells (gated on YFP+ and GFP+ cells), 8 days after co-transduction of sorted DN3 cells with KN6-γδTCR and MigR1 control, Fli-1 or shRNA Fli-1 retrovirus. Graphed data show mean + SEM of fold difference in DP development in Rag-1−/− KN6-γδTCR/Fli-1 or shRNA Fli-1 co-transduced cells versus control of 5 independent experiments, each comprised of a single sample per group.

