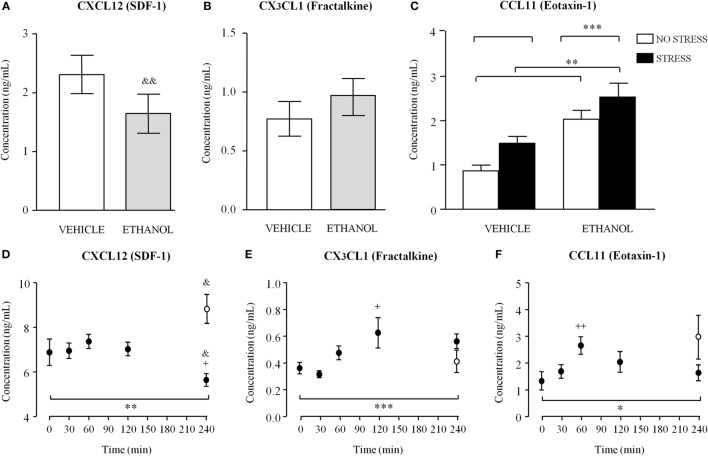
Figure 4.
Plasma concentrations of CXCL12 [stromal cell-derived factor-1 (SDF-1)], CX3CL1 (fractalkine), and CCL11 (eotaxin-1) in male Wistar rats exposed to ethanol and acute stress. (A) CXCL12 (SDF-1) and (B) CX3CL1 (fractalkine) concentrations were determined in rats exposed to ethanol (3 g/kg, i.g.) during 4 weeks or vehicle. (C) CCL11 (eotaxin-1) concentrations were determined in rats exposed to ethanol (3 g/kg, i.g.) during 4 weeks or vehicle with/without acute stress before ethanol exposure. Bars are means and SEM (nanograms per milliliter). CXCL12 and CX3CL1 concentrations were analyzed by Student’s t-test and &&p < 0.01 denotes significant differences compared to the vehicle group. CCL11 concentrations were analyzed by two-way analysis of variance (ANOVA) and **p < 0.01 and ***p < 0.001 denote significant main effect of “stress” and “ethanol exposure,” respectively. (D) CXCL12 (SDF-1); (E) CX3CL1 (fractalkine); and (F) CCL11 (eotaxin-1) concentrations were determined in rats exposed to acute ethanol (3 g/kg, i.g.) at 0, 30, 60, 120, and 240 min after ethanol exposure. Circles are means and SEM (nanograms per milliliter). CXCL12, CX3CL1, and CCL11 concentrations were analyzed by one-way ANOVA and *p < 0.05, **p < 0.01, and ***p < 0.001 denote significant main effect of “time.” +p < 0.05 and ++p < 0.01 denote significant differences compared to t = 0 min. White circles are means and SEM (nanograms per milliliter) at t = 240 min with no ethanol exposure and concentrations were analyzed by Student’s t-test. &p < 0.05 denotes significant differences compared to t = 0 or 240 min with no ethanol.

