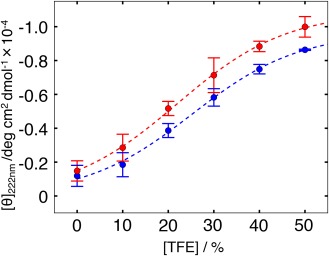
Figure 8.

TFE‐concentration dependence of mean molar ellipticity per residue, [θ], at 222 nm at 25°C for NonAc and Ac fragments. Blue and red points, respectively, present θ for the NonAc and Ac fragments. The smaller the value of θ at a TFE concentration, the greater the helix content at the concentration. Blue and red broken lines, respectively, stand for fitting lines of the points of NonAc and Ac by the sigmoidal function. [Color figure can be viewed at wileyonlinelibrary.com]
