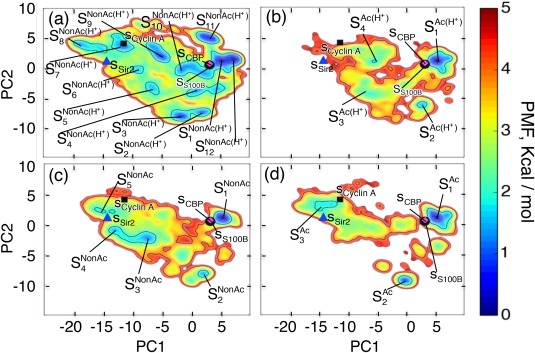
Figure 9.

FEL, , at 300 K for the common binding region (residues 380–386) constructed in 2D PCA space: a) , b) , c) , and d) . The lowest PMF site, , is set as kcal/mol. Clusters are shown in FEL. Black filled circle, blue triangle, black filled square, and magenta colored diamond, respectively, denote positions of the bound forms , , , and . Table 1 presents the correspondence between the CTD‐fragment type and the binding partner. PCA1 and PCA2 axes are computed from the entire ensemble (i.e., ). Consequently, the PCA axes for all panels are common. [Color figure can be viewed at wileyonlinelibrary.com]
