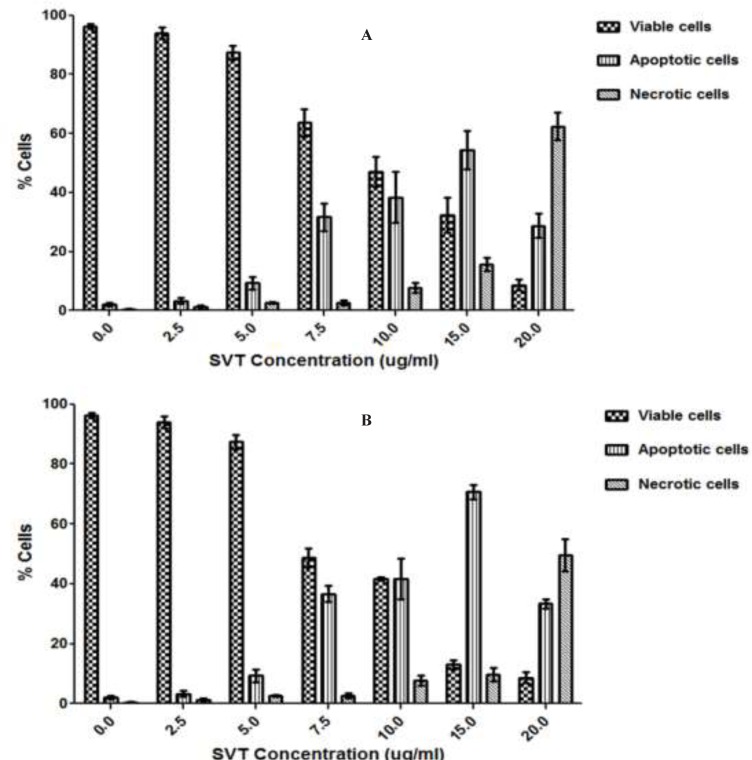
Figure 3.
Fluorescence microscopic analysis of cell death. HepG2 cells were treated with different concentrations of SVT for 24 and 48 h. Then the cells were harvested and stained with Acridine orange and ethidium bromide and were observed under fluorescence microscopy. 200 cells randomly were counted and percentages of viable, apoptotic and necrotic cells were calculated. Apoptotic cell death increased significantly (P<0.05) in a time and dose-dependent manner. However, no significant (P<0.05) difference was observed in the count of necrotic cells at concentrations below 10 µg/mL of SVT. (A) 24 h treatment. (B) 48 h treatment

