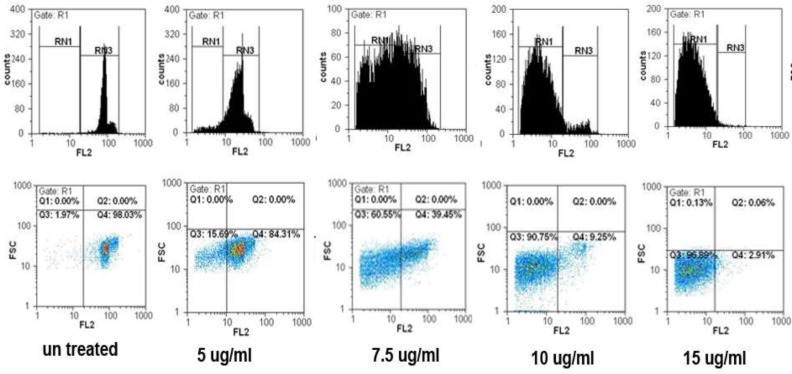
Figure 6.
SVT induced cell cycle arrest and apoptosis in HepG2 cells. The cells were treated with 0,5, 7.5, 10 and 15 µg/mL of SVT for 48 h. They were then harvested and stained with PI. Cell cycle, sub-G1 groups and apoptotic populations were examined by flow cytometry as described in methods section. Upper panels represent profiles of cell cycle, distribution of cells in the cell cycle and proportion of the sub-G1 cells. Lower panels show the proportion of apoptotic and normal cells

