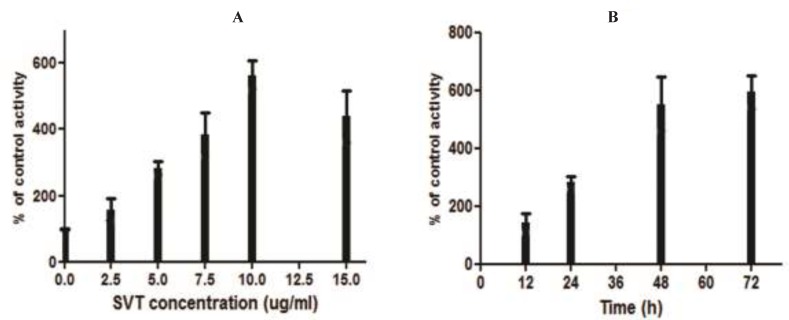
Figure 8.
Measurement of caspase-3 activity. (A) The cells were treated with different concentrations of SVT for 24 h and caspase-3 activity levels were measured by a commercial kit (Sigma). Mark increase in caspase-3 activity was seen by increase in SVT concentrations. (B) The cells were treated with 5 µg/mL of SVT for 72 h and caspase-3 activity levels were measured in 12, 24. 48 and 72 h. A time-dependent pattern was observed in caspase-3 activity

