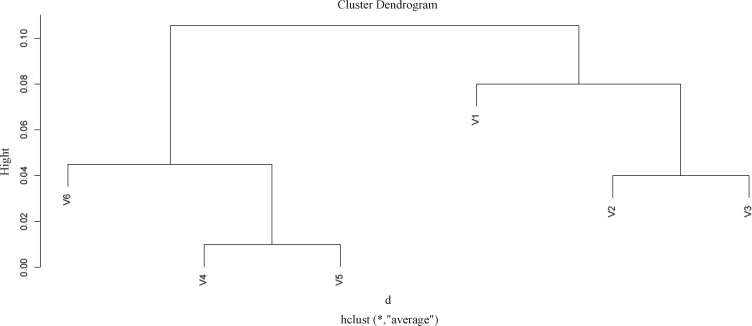
Figure 2.
Protein expression profile of six identified proteins based on their similarity to each other by application of R software. Cutting branches off the dendrogram assign clusters. The pairwise including protein V2 and protein V3 are close in changes in expression and grouped in distinct cluster; protein v4 and protein v5 are the most correlated spots in as grouped in a specific cluster. On the other hand, the v1 and v6 show against changes in expression behavior

