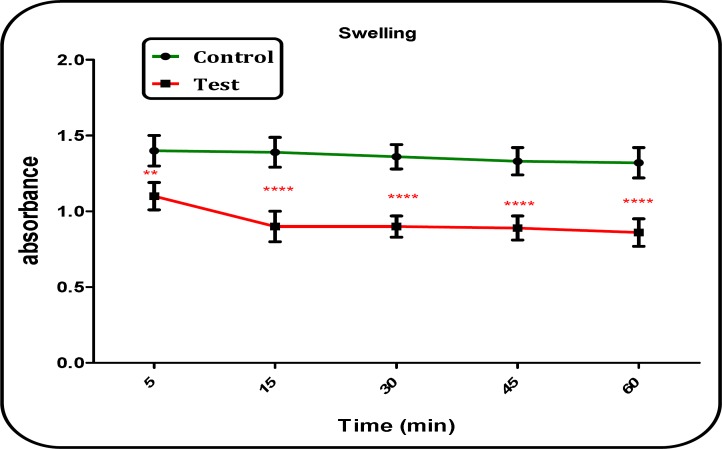
Figure 6.
Mitochondrial swelling in the brain mitochondria isolated from both Aβ peptide treated and untreated control rat groups. Mitochondrial swelling was measured by determination of absorbance of mitochondrial suspension at 540 nm. Values represented as mean ± SD (n = 3). ** and **** (P < 0.01 and P < 0.0001, respectively); significant difference compared with untreated control group mitochondria

