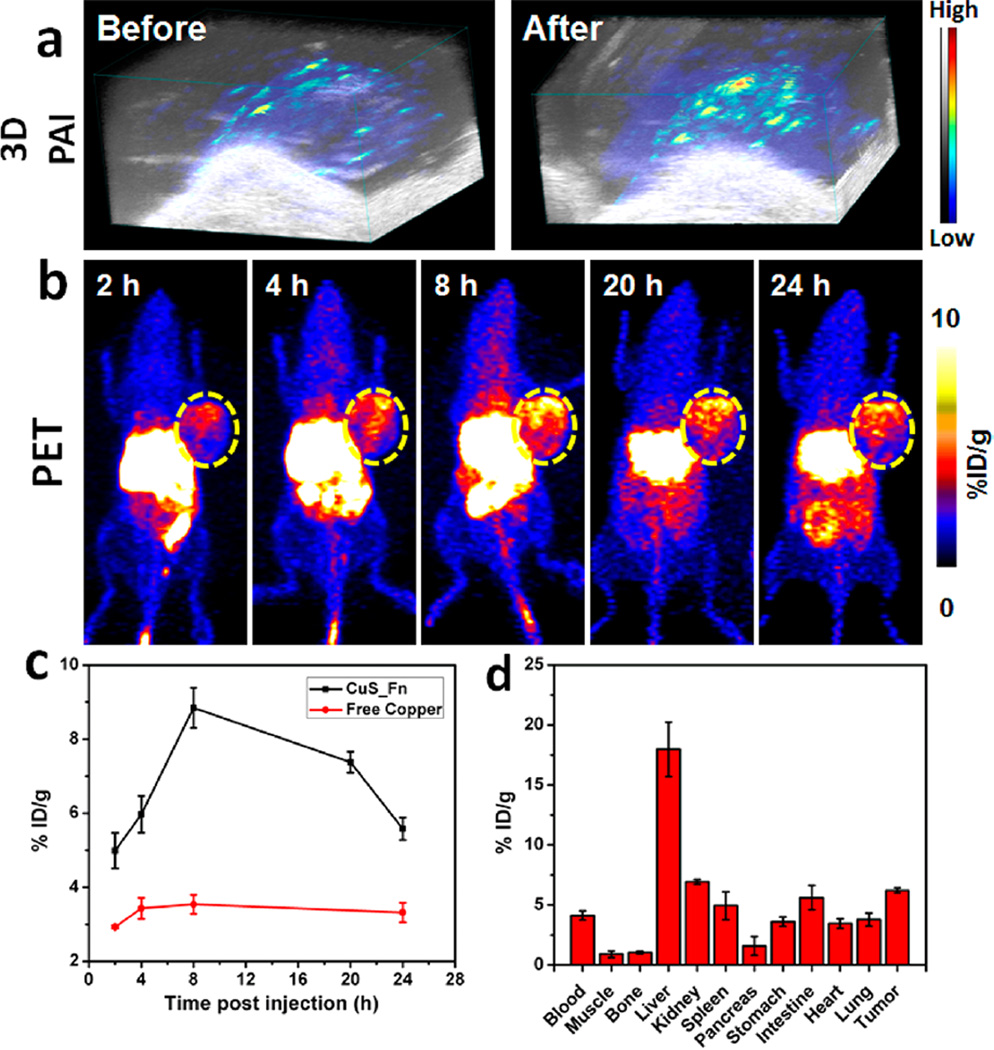
Figure 5.
Photoacoustic and PET imaging of CuS–Fn NCs. (a) 3D Photoacoustic images of U87 MG tumor pre- and post-CuS–Fn injection. (b) PET images of tumor bearing mice 2, 4, 8, 20, and 24 h after iv injection of 50 µCi 64CuS–Fn NCs. (c) Comparison of time-dependent tumor uptake between 64CuS–Fn NCs and free copper groups. (d) Biodistribution of tumor and primary organs at 24 h time point.

