
Figure 3. A subset of p97 cofactors is directly involved in the lysosomal damage response and forms a substrate‐stabilized complex.
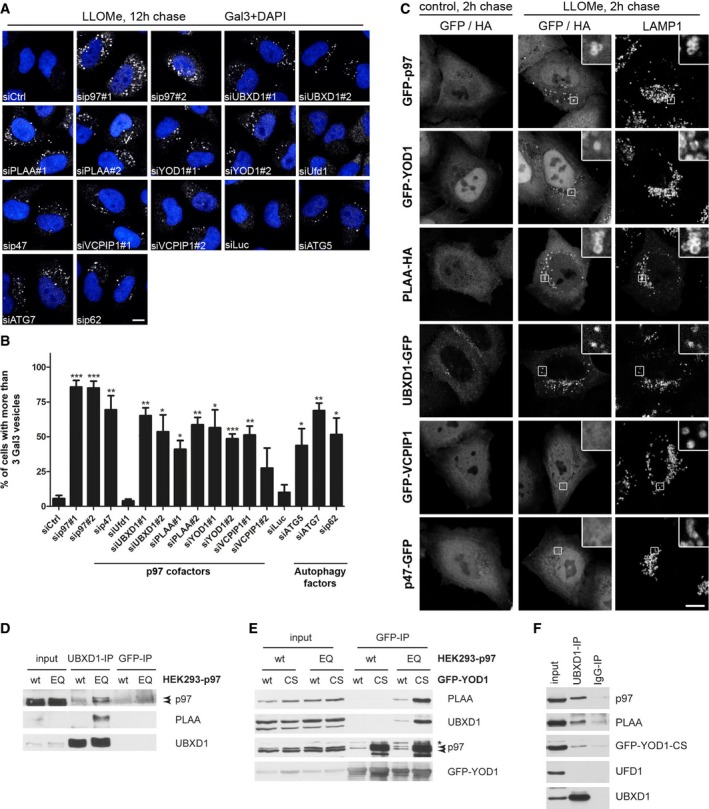
- Candidate screen for p97 cofactors involved in autophagy of damaged lysosomes. HeLa cells were transfected with indicated siRNA oligos and LLOMe‐treated for 1 h. Cells were chased for 12 h, fixed, and stained for Gal3. See Fig EV3 for depletion efficiency.
- Quantification of the percentage of cells with more than three Gal3 vesicles per cell for each condition. This threshold was chosen so that < 1% of untreated cells were considered positive. Data represent mean ± SEM of three independent experiments with ≥ 30 cells quantified per condition. *P < 0.05; **P < 0.01; ***P < 0.001 (one‐sided Welch's t‐tests).
- YOD1, UBXD1, and PLAA are translocated along with p97 to ruptured lysosomes. Cells expressing indicated tagged proteins were LLOMe‐treated for 1 h or with vehicle alone (control), fixed 2 h after washout, and stained for endogenous LAMP1 and, in the case of PLAA, with Alexa 488‐conjugated anti‐HA antibodies. See Fig EV3B for quantification.
- An ATP‐stabilized complex of p97 containing both UBXD1 and PLAA. Stable HEK293 cell lines were doxycycline‐induced to express p97 wild‐type (wt) or the ATPase mutant E578Q (EQ) at near endogenous level. Endogenous UBXD1 was immunoprecipitated and associated proteins detected by immunoblotting with indicated antibodies. Arrowheads indicate endogenous (lower band) and induced p97 (upper band).
- Stable HEK293 cells treated as in (D) and transiently expressing GFP‐tagged YOD1‐wt or the YOD1‐C160S catalytic mutant (CS) were processed for co‐immunoprecipitation with GFP nanobodies. Asterisk, unspecific band. Arrowheads indicate endogenous (lower band) and induced p97 (upper band). Note that the YOD1‐CS mutant stabilized p97 binding and, in the p97‐EQ background, also associated with UBXD1 and PLAA.
- Control (IgG) and UBXD1 co‐immunoprecipitation with indicated associated proteins from HeLa cells expressing GFP‐YOD1‐CS after formaldehyde cross‐linking. Ufd1 served as a negative control.