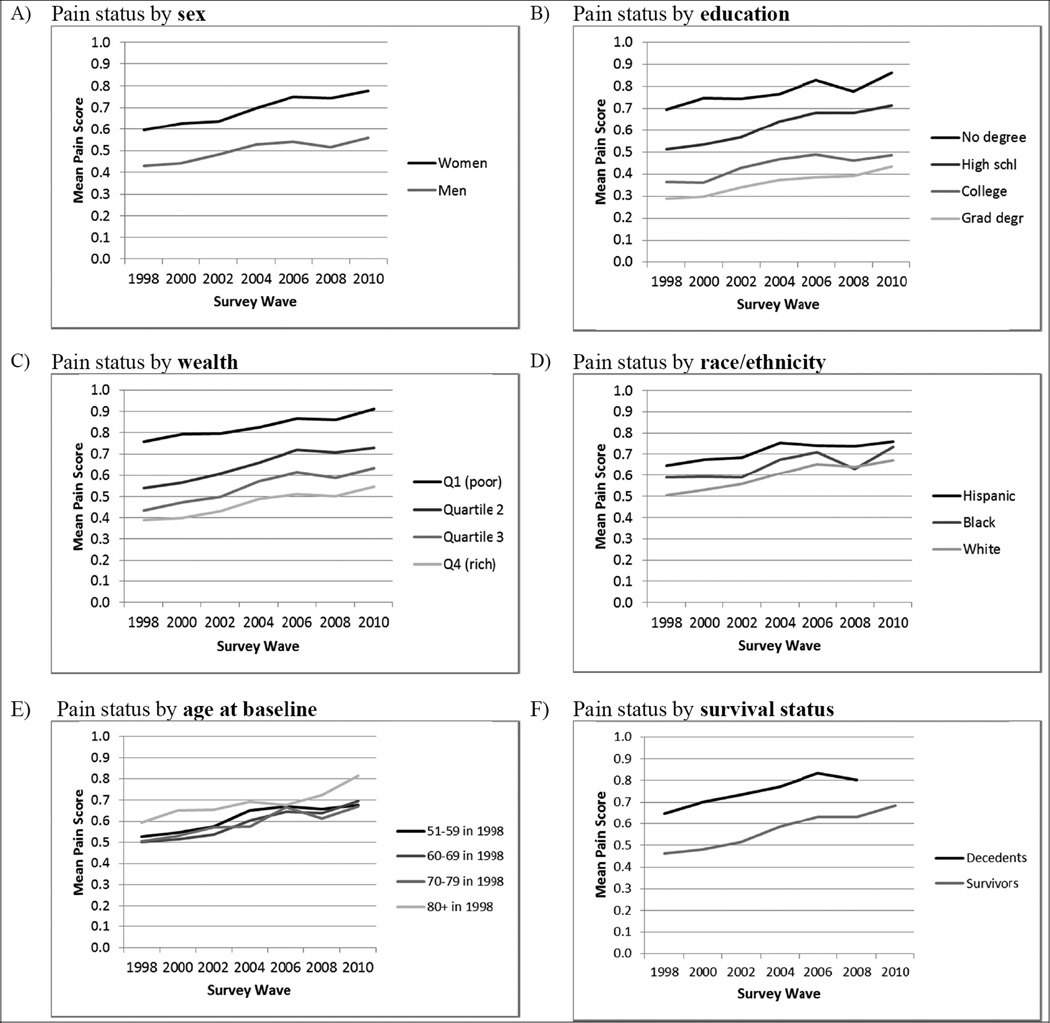
Fig. 2.
Mean pain status over time by sociodemographic characteristics (n = 19,776; from the Health and Retirement Study, 1998–2010). Means calculated by assigning scores: no pain = 0; mild pain = 1; moderate pain = 2; severe pain = 3. Sample weight adjusted. All differences by sex, education, wealth, and survival status (panels A, B, C, and F) are significant (P < 0.05, two-tailed) except between college and graduate degree, and, in 1998, between wealth quartiles 3 and 4. The only significant differences by race/ethnicity (panel D) are between Hispanics and whites, 1998–2006; and by baseline age (panel E) are between 80+ and younger groups, 1998 and 2000.

