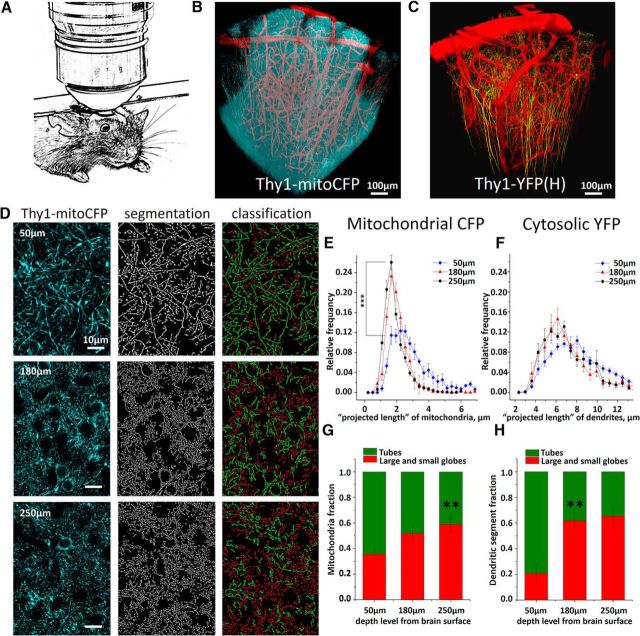
Figure 1.
Intravital two-photon imaging of neuronal mitochondria. A, Schematic showing anesthetized mouse with chronically implanted cranial window attached to the custom-built frame under two-photon microscope. B, C, The 3D reconstruction of mitochondria and dendrites of pyramidal neurons and blood vessels in somatosensory cortex of the Thy1-mitoCFP and Thy1-YFP mice. CFP targeted to mitochondria (cyan pseudocolor) and cytosolic YFP (yellow pseudocolor) are expressed only in a fraction of cortical neurons. Although expression is driven by neuronal Thy1-promotor in both lines, more neurons are labeled by CFP than by YFP. Cortical vessels (red pseudocolor) are labeled with Texas Red dextran. D, Single two-photon images (left panels) from layers I and II/III of somatosensory cortex of Thy1-mitoCFP mice were segmented (central panels) and classified (right panels) into small and large globules (red) or tubules (green) mitochondria subtypes. E, Average mitochondrial projected length distribution plotted at three different depth levels from the cortical surface. Asterisks indicate significant difference in the length between superficial and granular layers (F(1,17) = 22.55, one-way ANOVA, ***p < 0.001, Tukey's post hoc test). p < 0.001. F, Average distribution of dendritic tuft projected length calculated from single optical sections at three different depth levels from brain surface. G, Percentage of tubular and globular mitochondria at different cortical depths. Asterisks indicate significant increase in the fraction of globular mitochondria at the granular layer II/III (**p < 0.01, χ(1,17)2 = 44.86). H, Fraction of dendritic segments with projected globular length was higher in the deep cortical layers (**p < 0.01, χ(1,9)2 = 18.86).

