Figure 2.
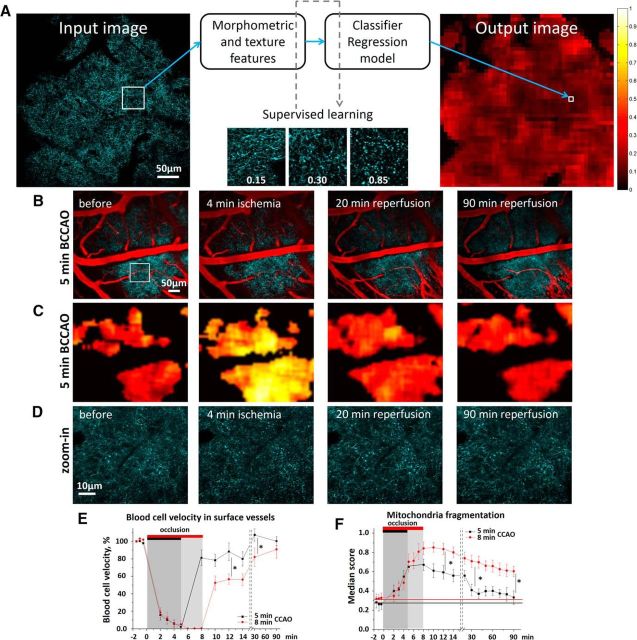
Short-term dynamics of neuronal mitochondria during global ischemia and reperfusion. A, Overview of the supervised learning-based quantification method that calculates the degree of fragmentation in a population of neuronal mitochondria from large-scale single-plane images. Morphometric and texture features automatically extracted from a patch and then fed to the classifier and the regression model, previously trained using the exemplar patches scored by an investigator. The regression model assumes the response variable of fragmentation score, whereas the classifier selects regions of interest. The mitochondrial fragmentation score for a single optical section is depicted as a heatmap. The contiguous black regions are non-region of interest (ROI) pixels, as determined by the classifier. B, Single optical section image of CFP-labeled neuronal mitochondria (cyan pseudocolor) and cortical vessels (red pseudocolor) before, at 4 min of occlusion, and 20, 90 min after reperfusion. C, Heatmaps of the fragmentation score from B reveal reversible mitochondrial fragmentation during reperfusion. D, Corresponding single-plane image of CFP-labeled mitochondria from the white boxed region shown in B. E, Quantification of changes in average RBC velocity in surface cortical blood vessels before and during 5 and 8 min of BCCAO and 90 min of reperfusion. Asterisks indicate significant difference between the groups in blood flow at 12 min (p = 0.017, F(1,9) = 9.11, one-way ANOVA; Tukey's post hoc test, *p < 0.05) and 30 min following reperfusion (p = 0.042, F(1,9) = 5.88, one-way ANOVA; Tukey's post hoc test, *p < 0.05). F, Mitochondrial fragmentation score before, during 5 and 8 min of BCCAO, and over 90 min following reperfusion. Asterisks indicate significant difference in the mitochondrial fragmentation score between mice subjected to the 5 or 8 min occlusion at 12 min (p = 0.018, F(1,9) = 8.79, one-way ANOVA; Tukey's post hoc test, *p < 0.05), 30 min (p = 0.011, F(1,9) = 10.78, one-way ANOVA; Tukey's post hoc test, *p < 0.05), and 90 min following reperfusion (p = 0.022, F(1,6) = 10.67, one-way ANOVA; Tukey's post hoc test, *p < 0.05).

