Figure 6.
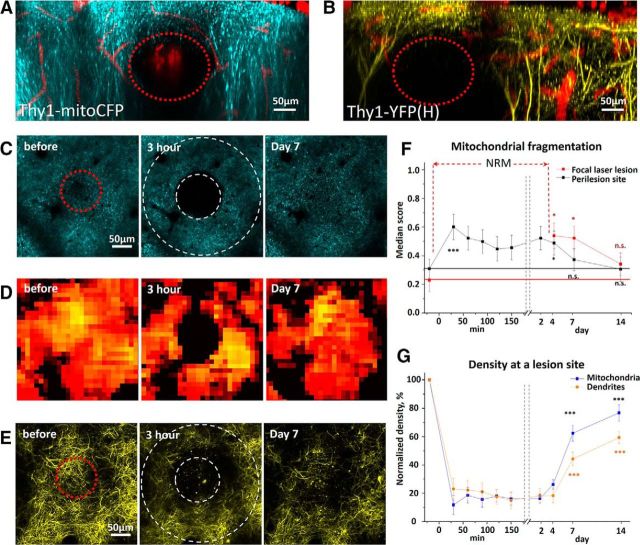
Long-term dynamics of neuronal mitochondria and dendritic structural integrity after moderate FLL. A, B, Maximum intensity projection images along the z-axis after FLL reveal complete loss of CFP and YFP fluorescence at the lesion site (red dashed circles) in somatosensory cortex of Thy1-mitoCFP (A) and Thy1-YFP (B) mice. C, D, Single optical section image sequences of CFP-labeled neuronal mitochondria (C) and heatmaps of the fragmentation score (D) reveal a loss of CFP signal at the lesion site and mitochondrial fragmentation at the perilesion site. Red dashed circle before FLL represents a laser target area. Two white dashed circles at 3 h after FLL represent the lesion site surrounded by the perilesion area (C). E, Maximum intensity projection image series showing dendritic injury at 3 h after FLL and spontaneous regrowth of dendrites to the lesion site by day 7. F, Mitochondrial fragmentation score at the lesion and perilesion site. At the lesion site, the classifier indicated ROI only by fourth day after FLL due to absence of identifiable mitochondria (NRM) in the image.*p < 0.05, significant difference from the control time point before FLL (paired t test). ***p < 0.001, significant difference from the control time point before FLL (paired t test). G, Average normalized density of neuronal mitochondria and dendritic tuft at a lesion site indicates recovery of mitochondria and dendrites over time after FLL. ***p < 0.001, significant difference from 3 h time point after FLL (paired t test).

