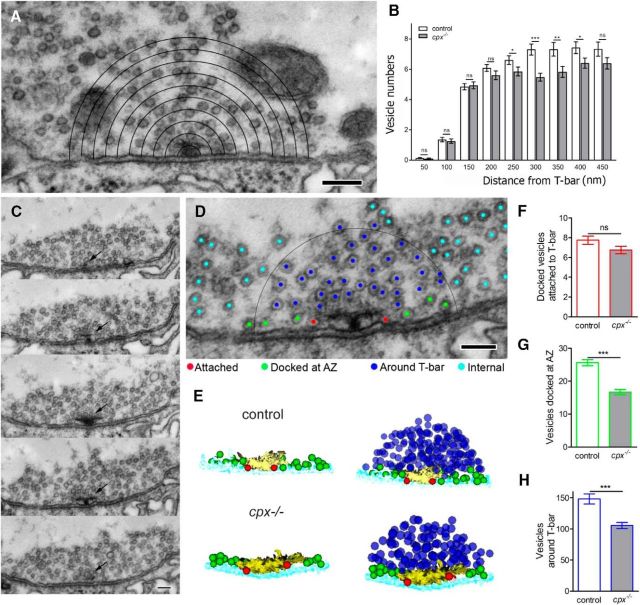
Figure 2.
Selective depletion of docked vesicles in the vicinity of T-bars in cpx−/− boutons. A, Micrograph illustrating morphometric analysis of vesicle numbers at different layers surrounding the T-bar. Scale bar, 150 nm. B, In cpx−/− boutons, vesicle numbers are unaltered in the immediate proximity to T-bars (50–200 nm) but significantly depleted at a distance of 250–400 nm from the T-bar. C, Subsequent serial sections showing an AZ (arrow) with a T-bar at the synaptic membrane surrounded by vesicles. Scale bar, 100 nm. D, Micrograph illustrating the vesicle classification according to their position at the T-bar: docked and attached to the T-bar (“Attached,” red); docked in the vicinity of the T-bar but not attached to it (“Docked at AZ,” green); around the T-bar (“Around T-bar,” within a 150 nm radius outlined by the black circle, blue); intraterminal vesicles not situated in the vicinity or around T-bars (“Internal,” cyan). Scale bar, 100 nm. C, 3D reconstruction of a T-bar surrounded by vesicles shows a selective depletion in the pool of vesicles docked at AZ (green) and around T-bar (blue). For clarity, left panels for control and cpx−/− AZs represent only the T-bar with docked vesicles. F–H, Vesicle numbers quantified from 3D reconstructions. D, The number of attached vesicles (red) is unaffected by Cpx deletion. E, The number of vesicles docked at AZ (green) is reduced in cpx−/− boutons. G, The number of vesicles around T-bar are reduced in cpx−/− boutons. All the vesicles for each AZ are counted from complete 3D reconstructions of AZs. Data collected from 56 WT and 57 cpx−/− AZs (4 larvae for each line). ***p < 0.001.

