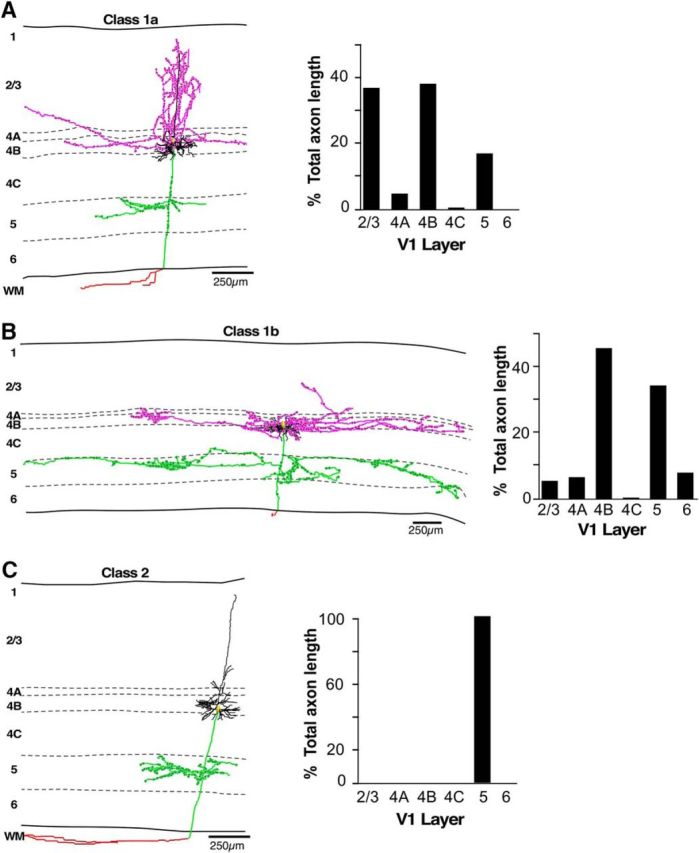
Figure 2.

Example of each L4B neuron class. A–C, Example reconstructions of labeled V1 L4B neurons for each class as determined by cluster analysis, and including a Class 1a pyramidal cell (A), a Class 1b stellate cell (B), and a Class 2 pyramidal cell (C). Bar charts to the right of each reconstructed cell indicate the percentage of total axon length in each layer for that cell. Dendrites are illustrated in black, supragranular axon branches in pink, infragranular axon branches in green, the axon in the white matter in red, and the soma in yellow. Solid black lines indicate the top and bottom of V1, and the dashed lines the laminar boundaries, with layers labeled for each cell. Note different scale bar for the more extensive Class 1b cell.
