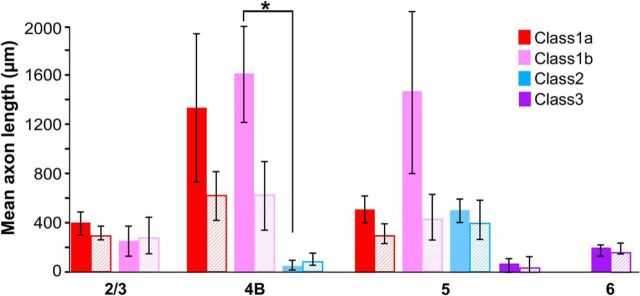
Figure 4.
Extent of axons in each layer for different cell classes. Histogram of the mean lateral extent of axonal projections in each V1 layer for each cell class and subclass. Solid and hatched bars indicate extent of connections measured parallel and orthogonal, respectively, to the V1/V2 border. Asterisk indicates statistically significant differences (p = 0.029). Error bars indicate SEMs.

