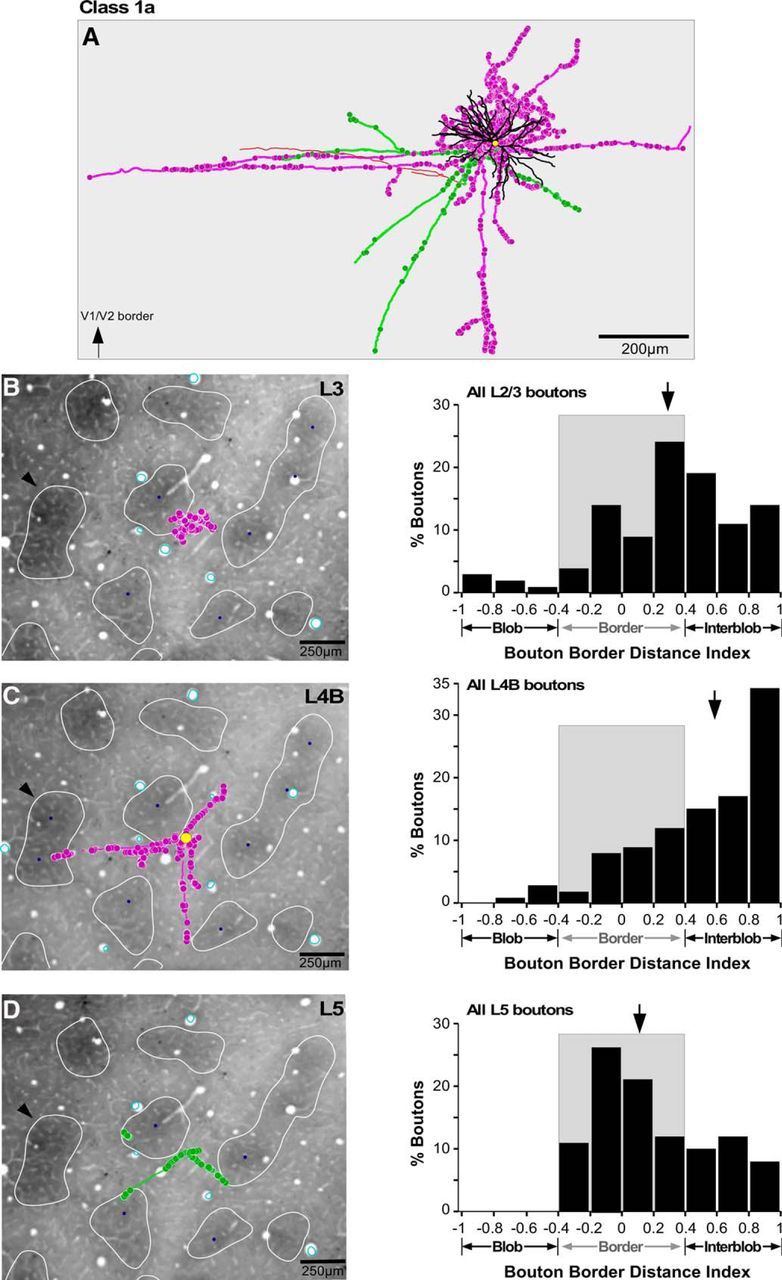
Figure 6.

Location of axons and boutons relative to CO compartments for an example Class 1a cell. A, Example reconstruction of a Class 1a pyramidal neuron whose soma was located at a blob border (same cell as in Fig. 2A, but viewed from the top). The arrow at the bottom left corner points to the V1–V2 border, which for all cells shown in Figures 6–8, is located toward the top of A. Conventions are as in Figure 2. B, C, The cell's axon and boutons (pink) from a single section in L3 (B) and a single section in L4B (C) are shown over a CO-stained tissue section of V1 to illustrate their location relative to CO compartments. The yellow dot in C marks the location of the soma. The CO blobs are outlined in white, and the blob centers (blue dots) are indicated only for the blobs used in each layer for the quantitative analysis of the BDI. Black arrows in B–D point at the same CO blob for referencing. Cyan ovals are the outlines of the radial blood vessels used for aligning the cell's drawings to the CO-stained tissue section. The histogram to the right of each panel indicates for that cell the distribution of BDI values for all boutons in the respective layer. Gray shading marks the CO blob border region. Arrows, Medians. D, Same as in B and C but for axon and boutons (green) in L5.
