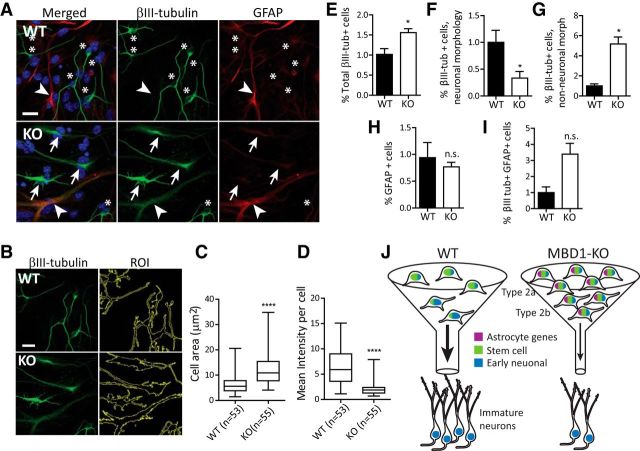
Figure 7.
MBD1 deficiency leads to aberrant differentiation of dgNPCs. A, Sample images of in vitro differentiated WT and MBD1-KO dgNPCs. Scale bar, 50 μm. In WT, βIII-tubulin/Tuj1 (green) marked neurons with small nuclei and narrow and well defined processes (asterisks) and GFAP (red) marks astrocytes with broad processes and a large nucleus (arrowhead). In MBD1-KO, βIII-tubulin staining was abnormal, characterized by cells with wide βIII-tubulin+ processes (arrows) and coexpression of GFAP (red; arrowhead). B, Analysis of βIII-tubulin+ cell shape using FIJI. Cell contours were selected with the ROI tool using standardized thresholds (right). Note: same image shown as in A. C, Box plot of average cell area in WT (n = 53) and MBD1-KO (n = 55) βIII-tubulin+ cells. D, Box plot of mean intensity per cell, t test, ****p < 0.0001. E–I, Cell quantification. Cell number was determined relative to DAPI+ cells/coverslip. For each cell type, results were normalized to the average of the WT samples, n = 3 pairs, paired t test. E, Total βIII-tubulin+ cells, p = 0.035. F, βIII-tubulin+ cells with neuronal morphology, p = 0.032. G, βIII-tubulin+ cells with non-neuronal morphology, p = 0.013. H, GFAP+ cells, p = 0.58 (n.s.). I, βIII-tubulin+ GFAP+ cells, p = 0.091 (n.s.). J, Proposed model depicting a function of MBD1 in adult neural stem cells and neurogenesis. Loss of MBD1-mediated repression increases expression of astrocyte genes (purple), which impedes the progression of neurogenesis, restricting the “passage (funnel) of differentiation” and causing cells to accumulate at earlier stages despite the upregulation of some early neuronal genes (blue).

