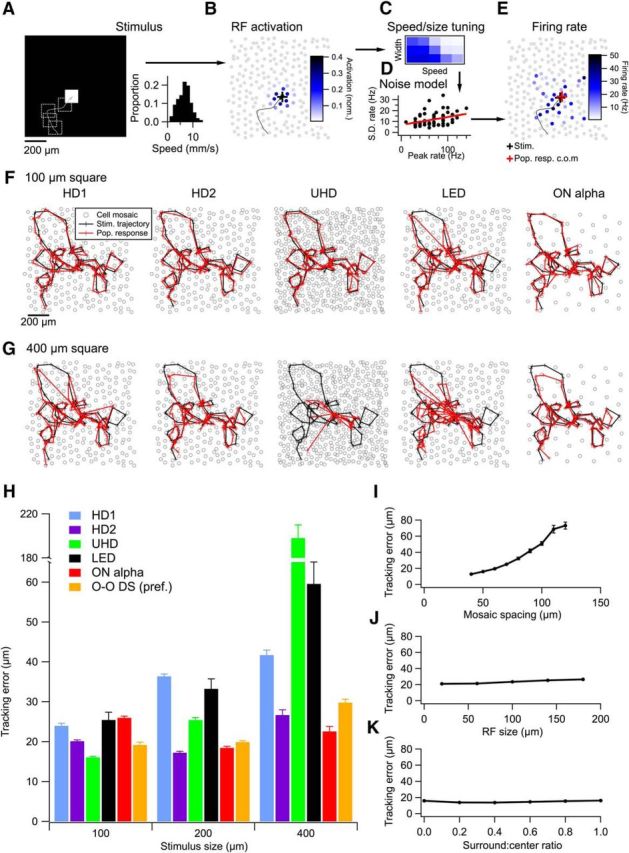
Figure 10.

Model of population responses of HD and LED RGCs tracking moving objects. A, Left, Schematic of the stimulus showing a white square on a single frame along with its previous trajectory (dotted lines). Right, Velocity distribution for the random walk of the square. B, A simulated mosaic of RGCs colored by their degree of RF overlap with the stimulus frame in A. C, Speed and size tuning (as in Fig. 8) was applied to the activation pattern in B based on the recent speed of the object. D, Noise model for each RGC type. Peak firing rate is plotted against its SD and fit with a line. This model is used to apply noise to each model RGC. E, Firing rates for the mosaic in B after incorporating measured speed and size tuning and the noise model. F, A model stimulus trajectory (black) and the center of mass of the population response (red) for simulated mosaics of HD1, HD2, UHD, LED, and ON α RGCs for a 100 μm square. Crosses represent 10 ms time steps. G, Sample trajectories as in F for a 400 μm square. H, Mean tracking error for each RGC type for three different square sizes. ON–OFF DS RGCs (O–O DS) were measured only in their preferred direction (see text). I, Tracking error as a function of mosaic spacing for a simulation in which all other parameters matched the profile of a UHD RGC. J, Same as I, but varying RF size instead of mosaic spacing. K, Tracking error for a UHD population as a function of surround-to-center ratio. Error bars in H–K are SEM across 10 trajectories for each data point. In some cases, the error bars are smaller than the symbols.
