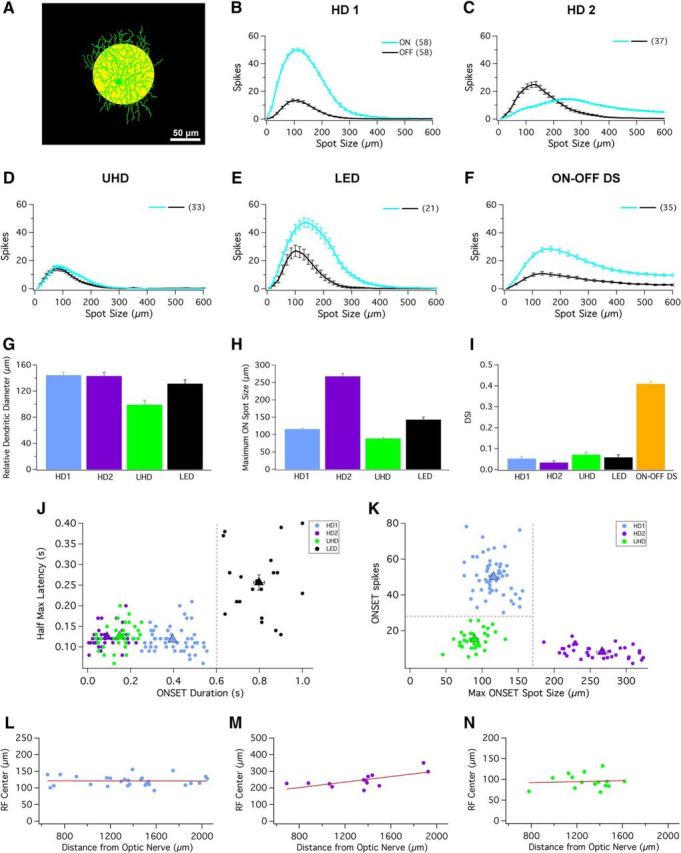
Figure 2.

HD cells possess small RF centers and strong surround suppression. A, Schematic depicting a 100 μm spot of light at 200 R*/rod/s (yellow spot) presented from darkness. Scale bar, 50 μm. B–F, Bright spots of multiple sizes (ranging from 10 to 600 μm) presented to RF center of (B) HD1, (C) HD2, (D) UHD, (E) LED, and (F) ON–OFF DS RGCs. ON (cyan) and OFF (black) responses elicited from bright spots from dark background. G, Bar graph depicting the relative dendritic diameter for HD1 (blue), HD2 (purple), UHD (green), and LED RGCs (black). H, Bar graph depicting the relative spot size that generates maximal response for HD1 (blue), HD2 (purple), UHD (green), and LED RGCs (black) during presentation of spots of multiple sizes from darkness. I, Bar graph of the average direction selectivity index (DSI) for HD1 (blue), HD2 (purple), UHD (green), LED (black), and ON–OFF DS RGCs (orange). Error bars are SEM across recorded cells. J, Scatter plot of response duration versus latency (100 μm spots; see Materials and Methods) for the ON responses of the three HD RGCs and the LED. A boundary of 0.6 s response duration (dashed gray line) separates LEDs from HD RGCs. K, Scatter plot of maximum onset response spot size versus number of spikes at that spot size for the three HD RGCs. Decision boundaries of 175 μm and 28 spikes (dashed gray lines) place each HD RGC type in its own quadrant. For both scatter plots, each dot represents the coordinates of a single recorded cell; triangles represent mean of each individual cell type with SEM. Scatter plots for (L) HD1, (M) HD2, and (N) UHD RGCs display the maximal ON spot size corresponding to the size of the RF center versus retinal eccentricity (distance from optic nerve head).
