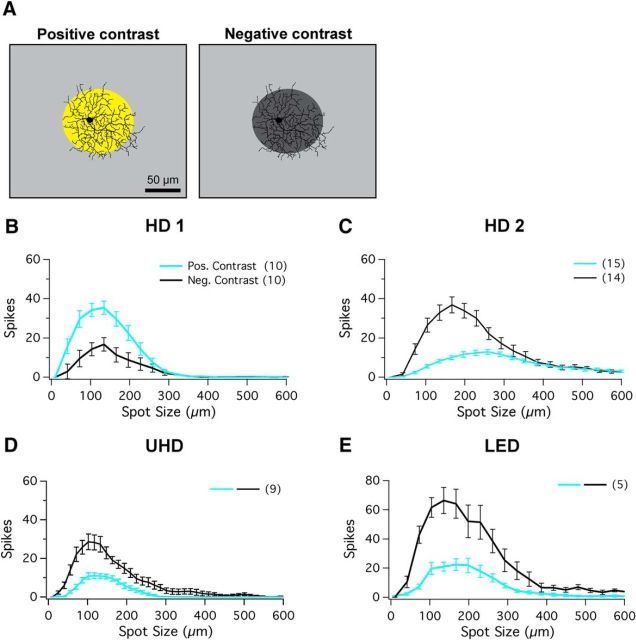
Figure 3.
RF structure of HD RGCs in photopic conditions. A, Left, Schematic of positive-contrast stimuli for spots of multiple sizes of bright spots from background mean illumination (R* values provided in text). A, Right, Schematic of negative-contrast stimuli for spots of multiple sizes of dark spots (0 R*/rod/s; dark gray spot) from background mean illumination. Scale bar, 100 μm. B–E, Positive-contrast and negative-contrast spots of multiple sizes (ranging from 10 to 600 μm) presented to RF center for (B) HD1, (C) HD2, (D) UHD, and (E) LED RGCs. Positive-contrast responses (ON) are shown in cyan and negative-contrast responses (OFF) are shown in black.

