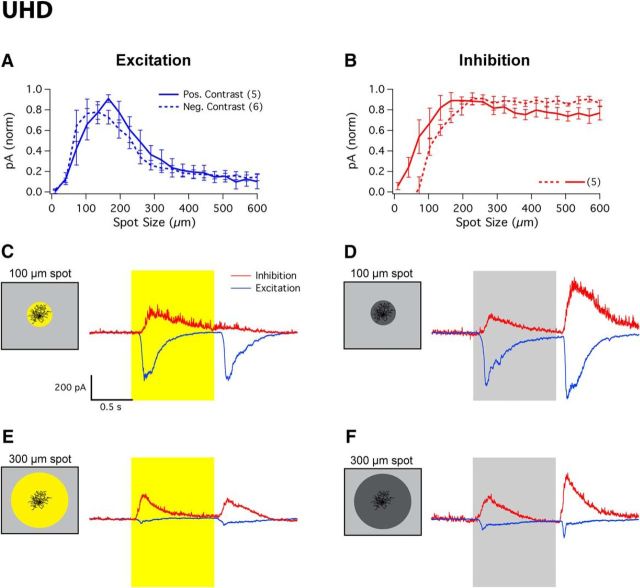
Figure 6.
Excitatory and inhibitory currents of UHD RGCs. A, B, Whole-cell patch-clamp recordings from UHD RGCs measured in voltage clamp to isolate excitatory (A) and inhibitory (B) currents. ON response (cyan) and OFF response (black) elicited from bright spots of multiple sizes from background mean light level. C–F, Representative current traces for spots of positive or negative contrast of 100 and 300 μm. Schematics show the spot size and contrast level at which visual stimuli were presented for the corresponding representative traces.

