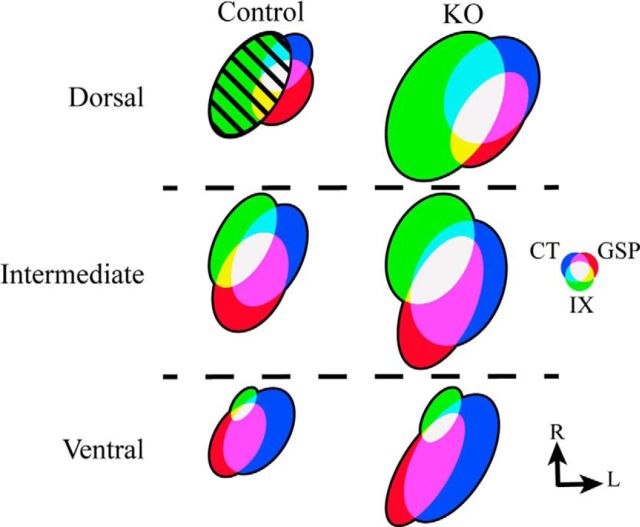
Figure 6.
Schematic of the terminal field organization in the NST in control (Control; left column) mice and αENaC knock-out (KO; right column) mice for the dorsal, intermediate, and ventral zones. For comparisons, the total volume of terminal field of the far dorsal and dorsal zones were summed and are represented here as the “dorsal zone.” The size of the terminal fields was calculated relative to the terminal field volume for the IX nerve in the control mouse (hatched green oval in dorsal zone; area = 1.0). The color of individual nerves and of their overlaps are shown in the color wheel, and the orientation of the ovals are shown as they appear in horizontal sections. R, Rostral; L, lateral.

