
Figure 1.
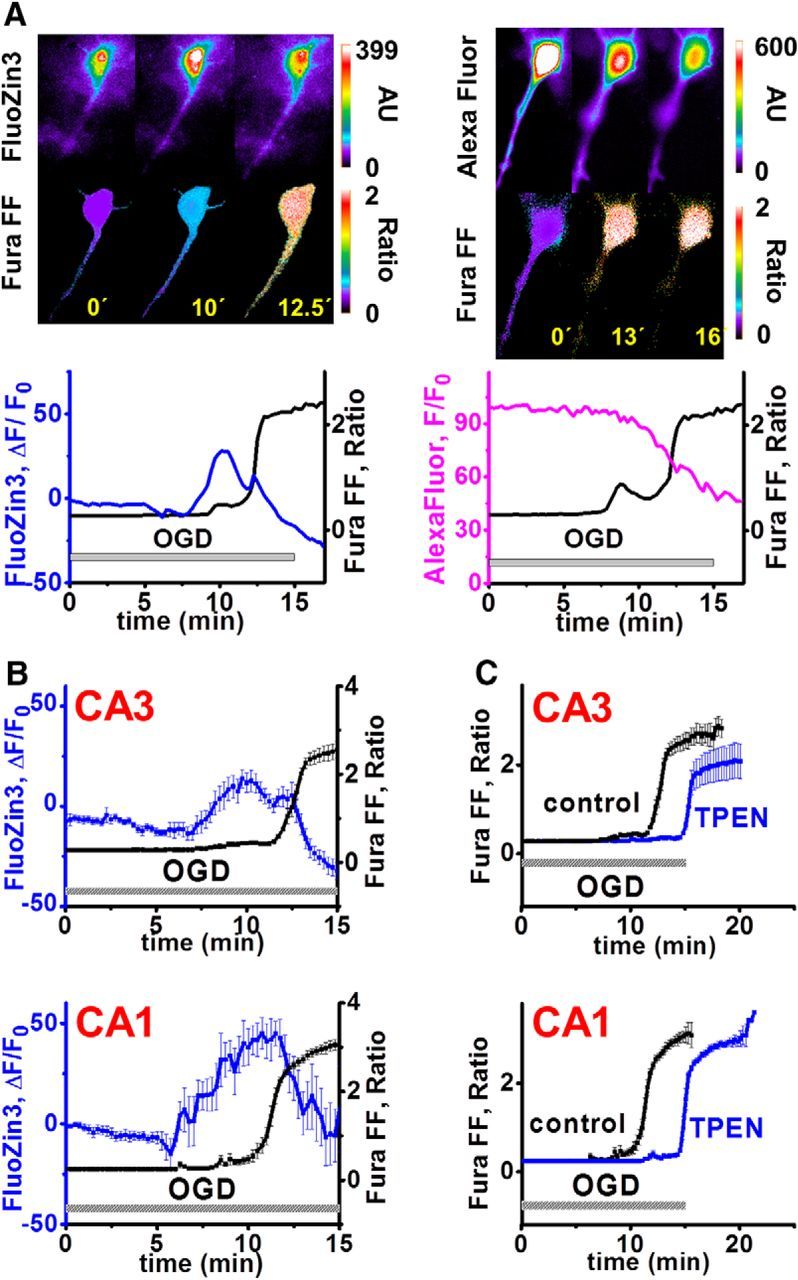
OGD-evoked Zn2+ rises precede and contribute to Ca2+ deregulation in both CA3 and CA1 pyramidal neurons. A, Relationship between intracellular Zn2+ and Ca2+ rises and loss of membrane integrity in individual CA3 neurons subjected to OGD. Pseudocolor fluorescent images (top) show cells loaded with a low-affinity ratiometric Ca2+ indicator (Fura-FF; 340/380 ratio images), along with either a Zn2+-sensitive indicator (FluoZin-3, background subtracted emission intensity, arbitrary units, AU; left) or an ion-insensitive fluorescent compound (Alexa Fluor-488, background-subtracted emission intensity, AU; right) and subjected to 15 min of OGD. Numbers indicate time (in minutes) after the onset of OGD. Traces (bottom) show fluorescence changes in the same neurons. Note that the Zn2+ rise precedes a sharp Ca2+ deregulation event (left) and that the Ca2+ deregulation is accompanied by a loss of the Alexa Fluor-488 signal (one cell representative of four; right), indicative of loss of membrane integrity. B, Zn2+ rises precede the terminal Ca2+ deregulation in CA3 as well as CA1 pyramidal neurons. Individual FluoZin-3- and Fura-FF-loaded CA1 and CA3 neurons were subjected to OGD; traces (±SEM; aligned for the onset of Ca2+ deregulation) show mean changes in somatic FluoZin-3 fluorescence (ΔF/Fo; blue) and Fura-FF ratio changes (black; CA3, top: Zn2+ rise 7.7 ± 0.6 min, Ca2+ rise 11.6 ± 0.6 min, n = 8, p = 5.1 × 10⁻⁴; CA1, bottom: Zn2+ rise 7.5 ± 0.5 min, Ca2+ rise 10.6 ± 0.5 min; n = 9, p = 3.4 × 10⁻⁴; the interval from the Zn2+ rise to the Ca2+ deregulation was not different between CA1 and CA3; p = 0.452, ANOVA linear contrast). C, Similar Zn2+ contributions to the occurrence of terminal Ca2+ deregulation in CA3 and CA1 pyramidal neurons. Hippocampal slices were subjected to OGD alone (black) or in the presence of the Zn2+ chelator TPEN (40 μm; blue). Traces (±SEM; aligned for the onset of Ca2+ deregulation) show mean Fura-FF ratio changes (CA3, top: control: 11.2 ± 0.7 min, n = 9; TPEN: 14.4 ± 0.6 min, n = 6, p = 5.3 × 10⁻³; CA1, bottom: control: 10.6 ± 0.5 min, n = 9; TPEN: 14.7 ± 0.7 min, n = 9, p = 1.1 × 10⁻⁴; TPEN-induced delay in Ca2+ deregulation was not different between CA3 and CA1, p = 0.62, ANOVA linear contrast).