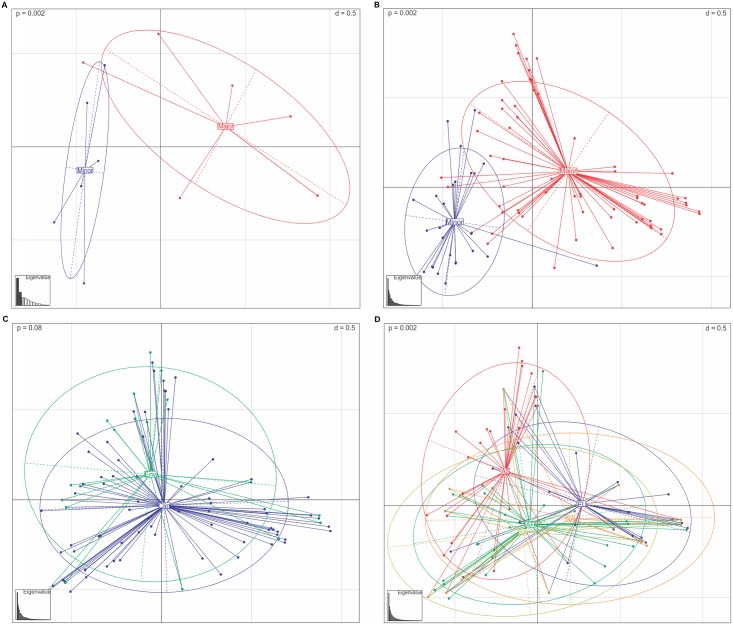
Fig 4. Principle Components Analysis of Cryptococcus neoformans var. grubii VNI allelic profiles depicted according to: A) the southeastern Brazilian population (13 STs), B) C. neoformans population using the global dataset (92 STs), C) isolates distributed according to clinical and environmental sources (104 STs), and D) distributed according to continents (136 STs).
Dots represent STs linked by coloured lines to form clusters, proportional in sizes to the number of isolates. The two main clusters identified in the C. neoformans population are highlighted in blue (minor) and red (major). The samples recovered from clinical (Clin) and environmental (Env) sources are highlighted in blue and green respectively. The colours of each continent of origin are described as follows: blue: Europe (EU), brown: South America (SA), green: Africa (AF), orange: North America (NA), red: Asia (AS). Eigenvalues highlighting the two first components are represented in the bar plot. The p-value calculated using the Mont Carlo test is described in the upper left side.

