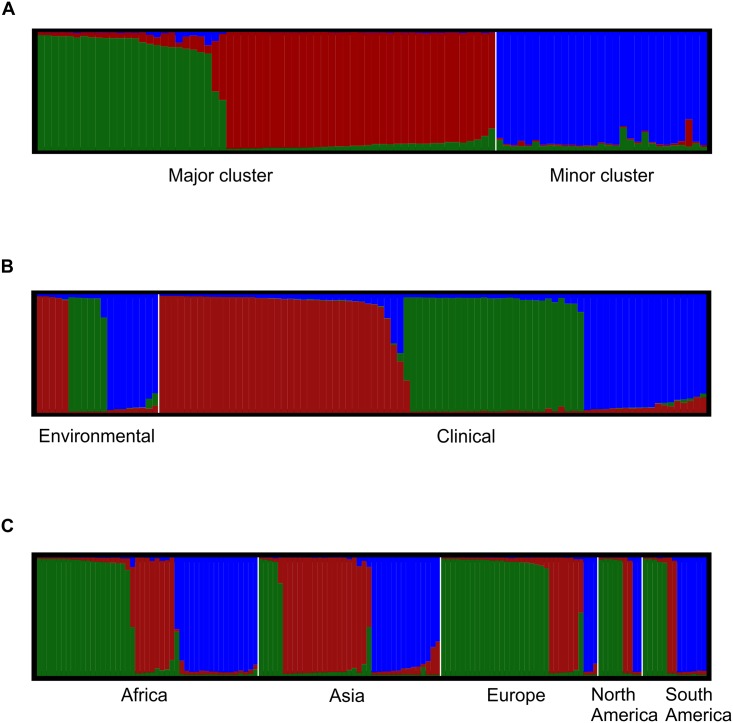
Fig 5. Structure analyses of Cryptococcus neoformans var. grubii VNI showing that K = 3 is the actual number of subpopulations. Clusters of individuals based on prior-defined populations according to: A) major and minor main clusters identified in the phylogenetic and coalescence analyses using the expanded global dataset (92 isolates), B) clinical and environmental isolates (104 isolates), and C) according to continents (136 isolates).
Each vertical line represents one ST and the colours represent the most likely ancestry of each individual from the population. Individuals with multiple colours have admixed genotypes from the prior-defined subpopulations. One ST per region and/or per pre-defined subpopulation was used throughout the whole analyses.

