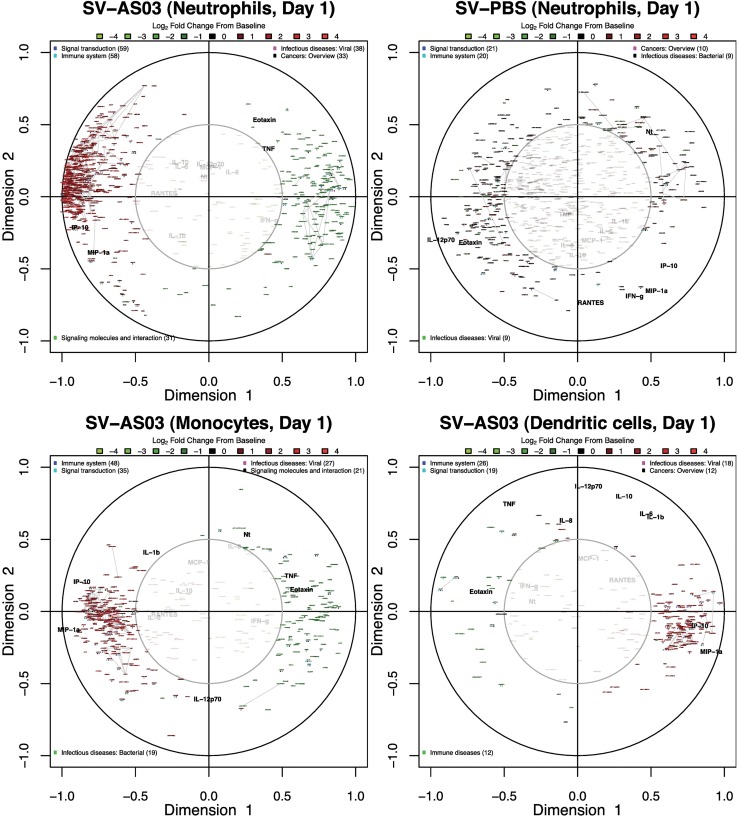
Fig 10. AS03-adjuvanted vaccine gene responses in neutrophils, monocytes and dendritic cells correlated with serum IP-10 and MIP−1α serum cytokine responses 1 day post-vaccination.
Canonical correlation plots summarizing key correlation patterns between changes in serum cytokine/antibody responses and gene responses at day 1 in (A,B) neutrophils (SV-AS03 and SV-PBS, respectively), (C) monocytes (SV-AS03), and (D) dendritic cells (SV-AS03). Red: upregulated genes; Green: downregulated genes; +/- gene name prefix: DE gene (yes/no); colored-dots: KEGG pathway class (BRITE level 2); grey lines: co-expressed gene clusters. The serum-based variable set (in black) included baseline log fold changes for 12 serum cytokines as well as baseline log fold changes of antibody titers (HAI: hemagglutination inhibition, Nt: microneutralization inhibition). The strength of the correlation is encoded by the distance from the center of the circle as well as by the angle between variables when viewed as vectors originating from the center. An acute angle (<90°) between variables represents a positive correlation, an obtuse angle (>90°) indicates a negative correlation, while a right angle is observed for zero correlation. Thus, maximum correlation is achieved when variables are closely placed together in the outer circle (or directly opposed on the outer circle.

