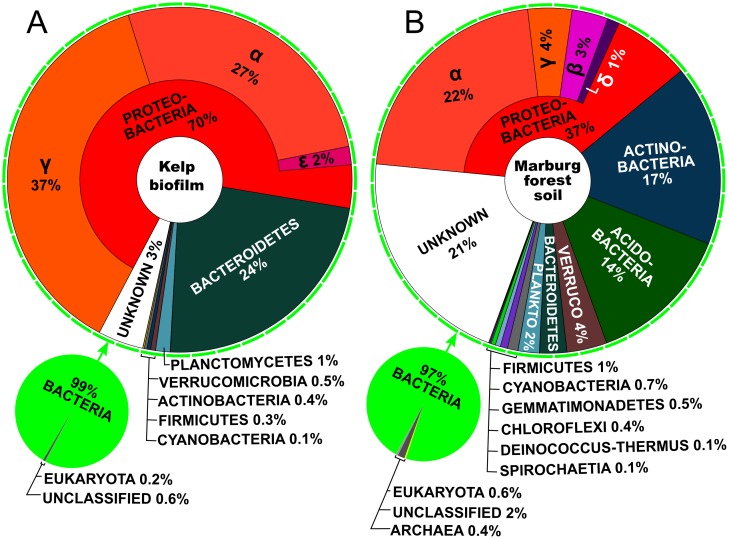
Fig 1. Predicted diversity and relative abundance of organisms represented in the unassembled read datasets.
Taxon assignments are based on diamond [68] blastx alignments of all reads against the NCBI nr database and subsequent LCA classification using MEGAN [69]. Large ring charts show detailed breakdowns of the different phyla representing the bacterial fractions in each dataset. The proteobacterial fraction is further broken down into the represented classes of this phylum. Small pie charts indicate the relative abundances of Bacteria, Eukaryota, Archaea and unclassified organisms within the subset of reads which could be assigned at least to the “cellular life form” level. The depicted charts were adapted from visualizations produced by KRONA [70]. Similar analyses, based exclusively on universal marker genes and performed using PhyloSift [71], show almost identical relationships between taxons, albeit with lesser detail and slightly higher estimations for eukaryotic and archaeal fractions (S1 Fig).

