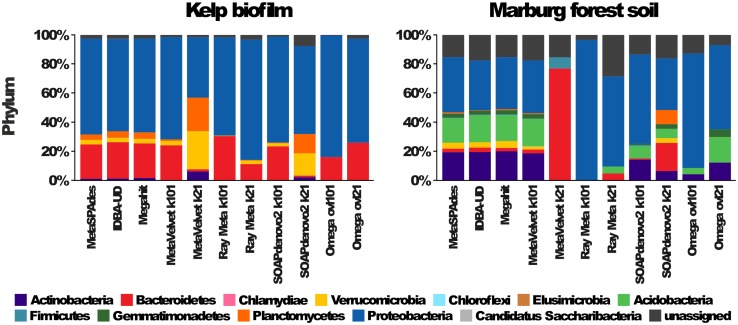
Fig 8. Differences in phylogenetic profiles based on different assemblies of Kelp Biofilm (KBF) and Marburg forest soil (MFS) samples.
Phylogenetic profiles are based on 40 single copy marker gene products identified with fetchMG (www.bork.embl.de/software/mOTU/fetchMG.html) and annotations based on alignments against the NCBI-nr database and the least common ancestor (LCA) method implemented by MEGAN5 [69]. The phylogenetic profiles show the number of marker gene products assigned to different taxa on phylum level. Additional profiles showing the class and order levels are given in S2 Fig.

