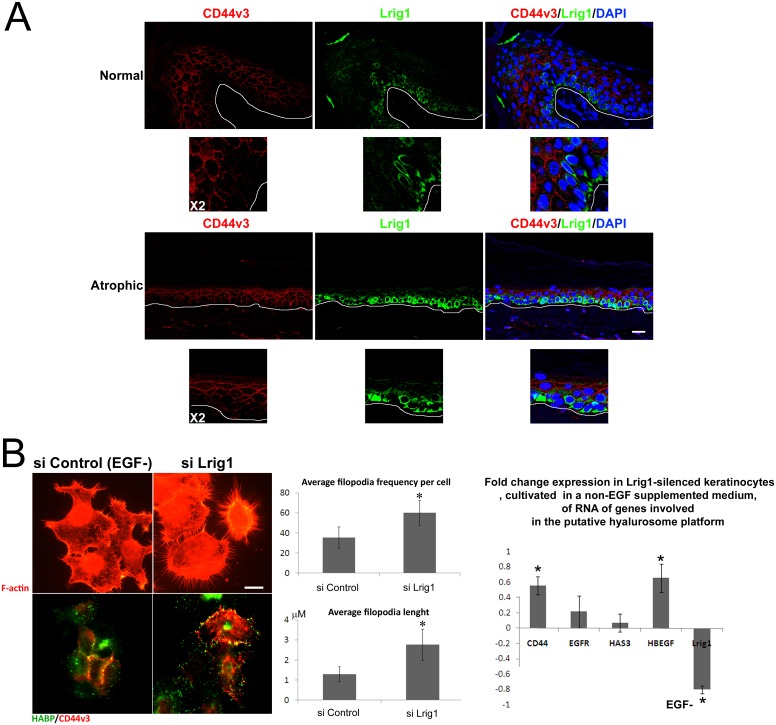
Fig 3. Lrig1 niche lacks CD44v3 expression.
(A) Lrig1 (green) and CD44v3 (red) co-staining in healthy and atrophic epidermis, blue = DNA, (B) F-actin staining (red), and co-staining of HA (green) and CD44v3 (red) on keratinocytes transfected either with scramble siRNA or with Lrig1-targeting siRNA: quantification of filopodia length and frequency per cell calculated as the average value determined on 10 cells and fold change expression measured by quantitative PCR analysis of CD44, EGFR, HAS3, Hb-EGF and Lrig1 in similarly transfected keratinocytes (Y axis = fold change comparative expression between scramble siRNA-transfected keratinocytes and Lrig1-silenced keratinocytes. In both cases, expression was previously standardized according to the EEF1 housekeeping gene expression. Bar = 25μm. * indicates average values different from the scramble siRNA value with p<0.05.

