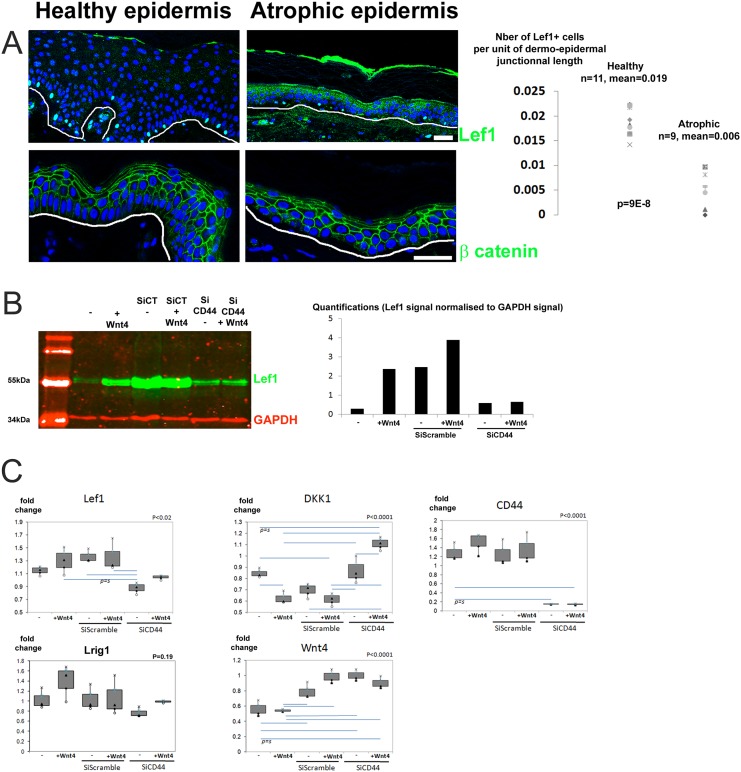
Fig 6. Lef1 expression is downregulated in senescent atrophic human epidermis and CD44 is required for Wnt signaling induction in human keratinocytes.
(A) Lef1 and β-catenin staining in the epidermis of the healthy and senescent atrophic groups. Arrowheads indicate the Lef1+ cells with quantification of Lef1 for each patient of each group calculated as the number of Lef1+ cell standardized according to the dermal-epidermal junction length and as the average of 3 microscope fields per donor. White line indicates the dermal-epidermal junction. (B) Lef1(green) and GAPDH(red) western blot on human keratinocyte extracts, using Wnt4 (50ng/mL), scramble siRNA and siRNA CD44 with quantification of the Lef1 signal standardized to GAPDH. (C) Quantitative PCR analysis of the expression of Lef1, DKK1, CD44, Lrig1 and Wnt4 transcripts in keratinocytes treated as in (B). Blue horizontal bars indicate significant differences according the p values calculated with the ANOVA analysis of variance test with post hoc Tukey test, with P the overall significance value ANOVA value. 3 independent experiments were performed for each point. Bar = 60μm.

