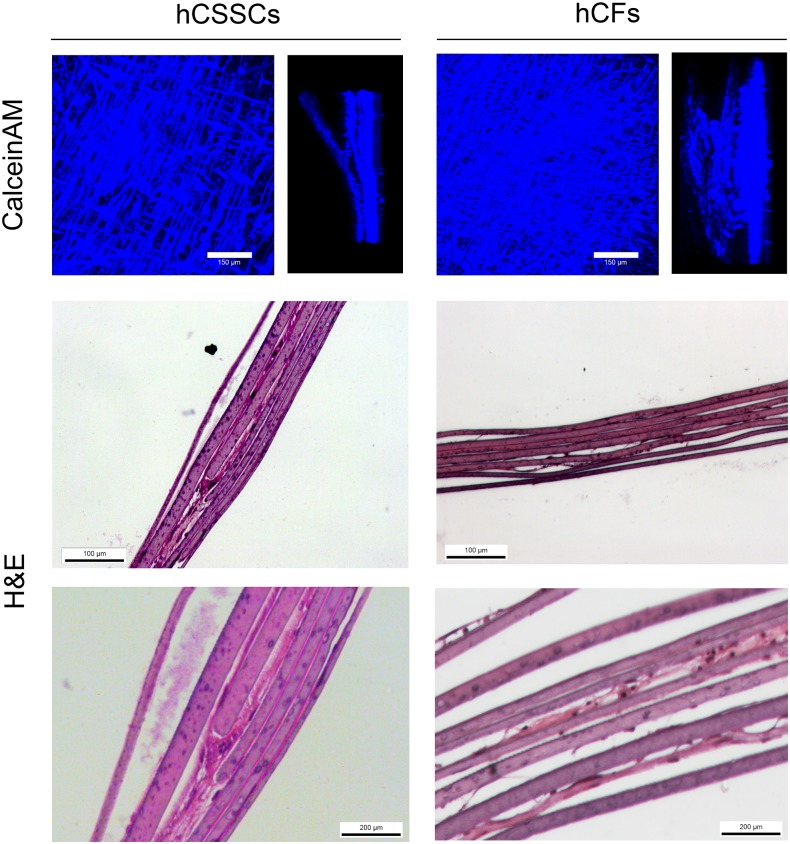
Fig 3. 3D hCSSC and hCF tissue equivalent distribution at 9 weeks.
Maximum intensity projections and side views of CLSM analysis of Calcein AM-stained hCSSCs and hCFs in the stroma equivalent. H&E staining of histological sections of stroma equivalent seeded with hCSSCs and hCFs showed evidence of ECM production at 9 weeks in culture. Scale bar = 100 and 200 μm.

