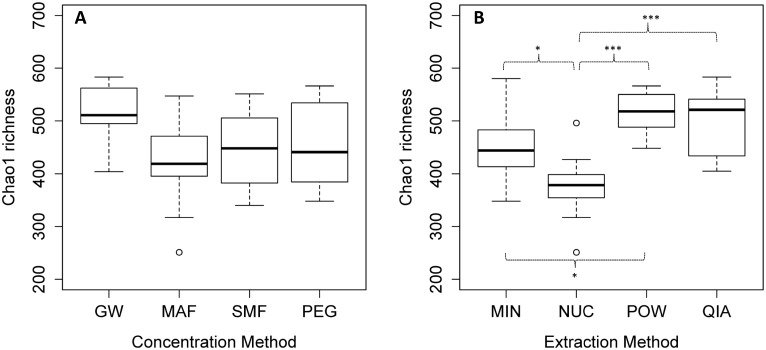
Fig 4. Viral species richness.
(A) Viral Chao 1 species richness of the tested concentration methods, and (B) extraction methods. Each boxplot was made from 12 individual samples (including the four extraction/concentration methods with three replicates each). The bar, box, whiskers and circles represents median, inter-quartile range, inter-quartile range times 1.5, and outliers, respectively. Asterisks represent significance level of a pairwise t-test with “Holm-Bonferroni” adjusted p-values. * = p < 0.05, ** = p < 0.01, *** = p < 0.001.

