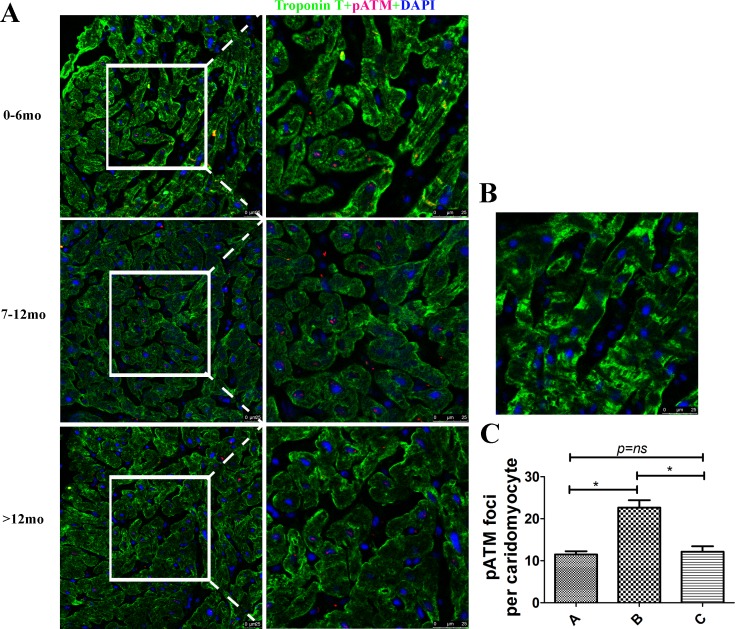
Fig 3. Oxidative DNA damage in hearts from different ages analyzed by p-ATM.
(A) Representative graph of groups A, B, and C. p-ATM was not positively correlated with ages, and group B (7–12 mo) had the highest amount of p-ATM. Cardiac troponin T (green), p-ATM (red), and DAPI (blue) staining; Scale bar = 25 μm. (B) Negtive control. Primary antibody was substituted with PBS. (C) Quantification of p-ATM foci per cardiomyocyte in each group, n = 20, **p < 0.01.

