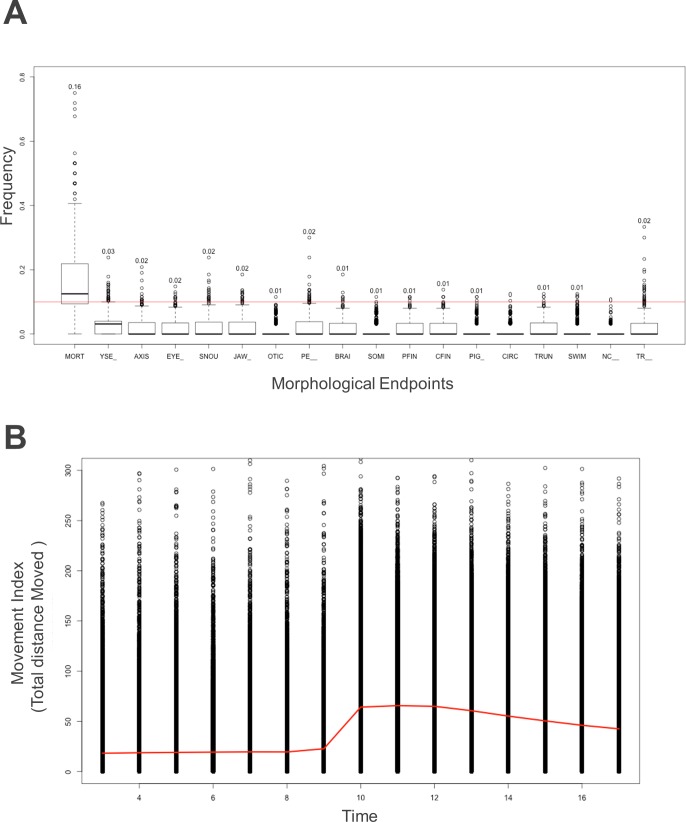
Fig 3. Overview of Controls.
A: Morphological overview of controls. Incidence rate assessment (Y axis) for all chemicals by endpoint (X axis). For mortality, rate was calculated with a sample size of 32. For other endpoints, rate was calculated conditionally on alive zebrafish larvae. The red line was drawn at 10% for visualization. B: Movement index overview: Plot of healthy (i.e. no annotated morphological endpoints) zebrafish larvae in control wells for all plates. Red line was drawn by connecting the mean of each experimental time point. Y axis: Movement Index; X axis: Time (minutes).

