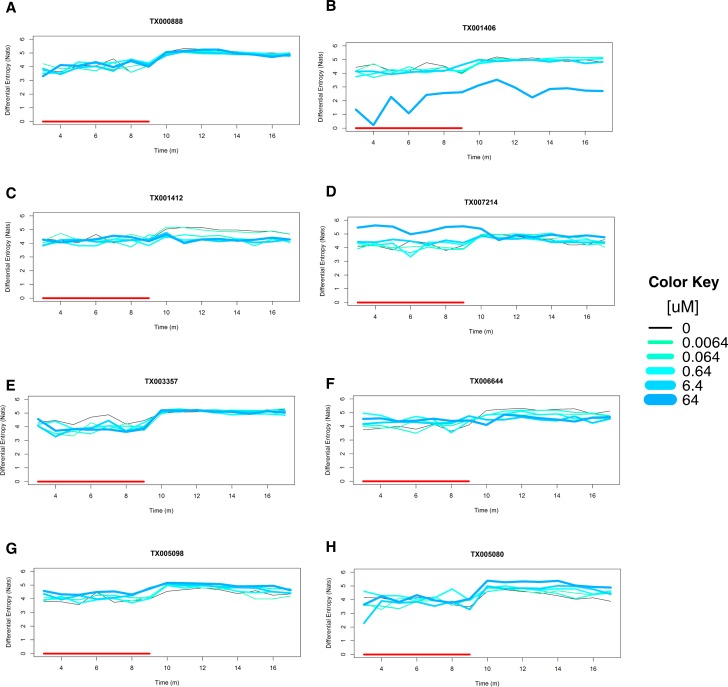
Fig 6. Behavioral response patterns.
Differential entropy of each concentration was plotted across experimental time. Color key is shown in Fig 1. Y axis: Differential entropy (Nats); X axis: Time (m). Red segments represent light condition from 3m to 9m. A: Inactive: TX000888 (Terbacil) was inactive at all concentrations. B: Hypoactivity (L) and Hypoactivity (D): TX001406 (Cyclanilide) shows significant hypoactivities at 64uM for both light and dark intervals. C: Inactive (L) and Hypoactivity (D): TX001412 (Fipronil) is inactive at light interval and shows significant hypoactivity at dark interval at 0.064uM, 0.64uM, 6.4uM, and 64uM. D: Hyperactivity (L) and Inactive (D): TX007214 (Dieldrin) shows significant hyperactivity at light interval but it is inactive at dark at 64uM. E: Hypoactivity (L) and Inactive (D): TX003357 (44’-Oxydianiline) shows significant hypoactivity at light interval and inactive pattern at dark interval at 0.064uM, 6.4uM, and 64uM. F: Hyperactivity (L) and Hypoactivity (D): TX006644 (Haloperidol) shows significant hyperactivity at light interval and significant hypoactivity at dark interval at both 6.4uM and 64uM. In addition, at 0.64uM, it shows significant hyperactivity at light interval. G: Hyperactivity (L) and Hyperactivity (D): TX005098 (4-Pentylaniline) shows significant hyperactivity at 64uM for both light and dark conditions. H: Inactive (L) and Hyperactivity (D): TX005080 (44’4”-Ethane-111-triyltriphenol) is inactive at light and shows significant hyperactivity at dark at 6.4uM and 64uM.

