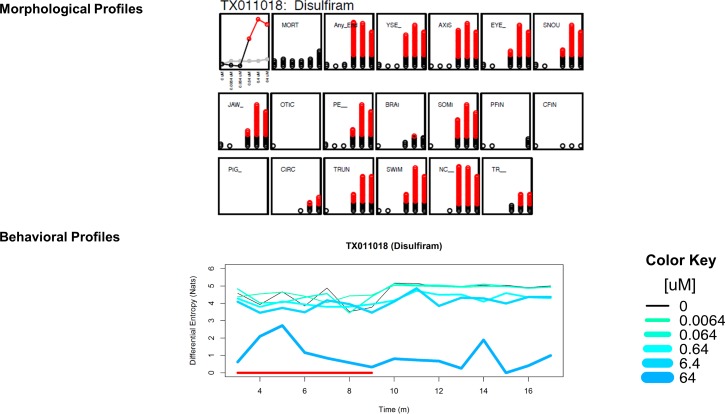
Fig 7. Relationship between morphological profiles and behavioral profiles.
Disulfiram significantly affected 13 endpoints starting at 0.64 uM. Disulfiram also caused significant hypoactivity in both intervals with a lowest effect level of 0.64 uM. For morphological profiles, the panels represent (from top left) Aggregate Entropy, mortality, summation of any endpoint, then each of the specific endpoints (see ‘Methods‘). The X axes show concentration (0uM, 0.0064uM, 0.064uM, 0.64uM, 6.4uM, 64uM from left to right). The Y axes show Aggregate Entropy for the first panel, then incidence counts for all other panels. Red indicates statistical significance for each measure (p < 0.05).

