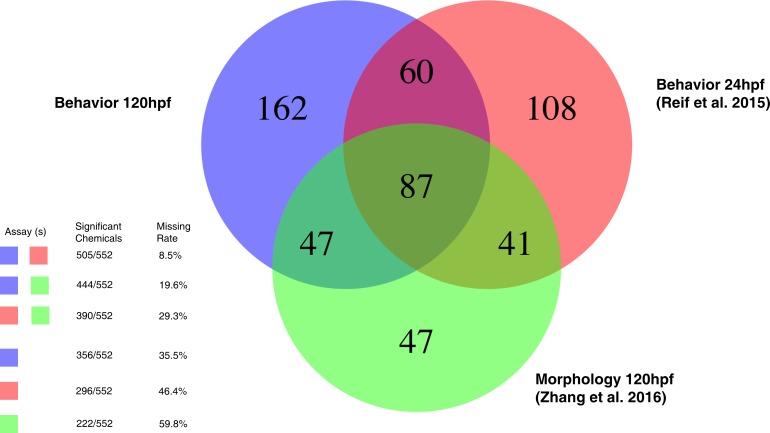
Fig 8. Summary of results by the whole experimental system.
This Venn diagram provides the summary of the total number of significant chemicals detected by each assay. It also provides statistics regarding the benefits of including all assays. Missing rate: the number of chemicals that would have been missed using a subset of these assays.

