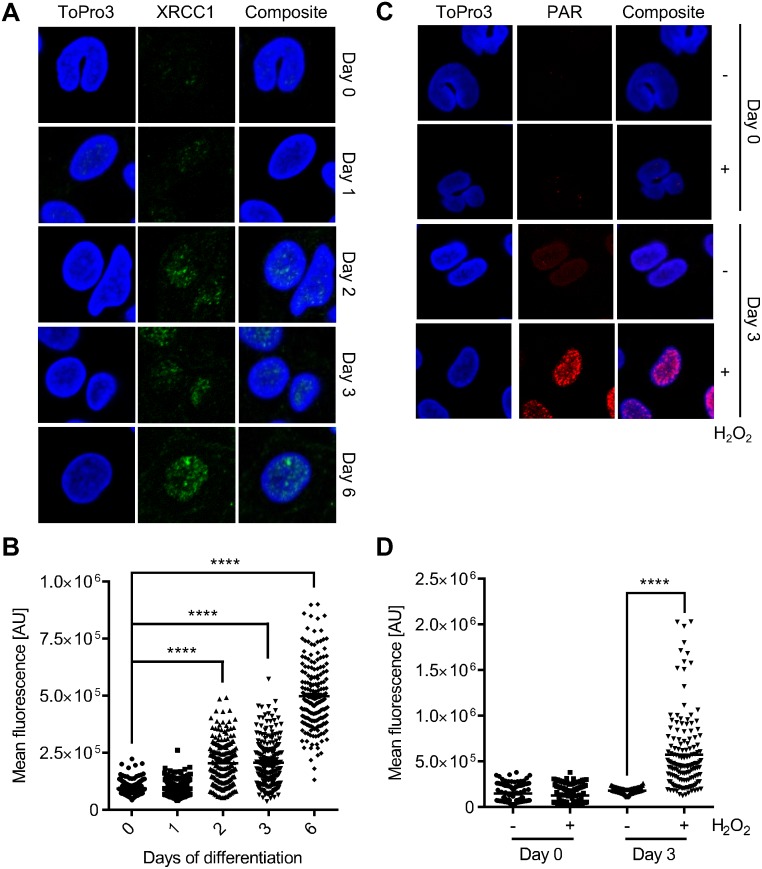
Fig 1. XRCC1 expression during macrophage maturation and poly(ADP-ribose) formation after hydrogen peroxide treatment in monocytes and monocyte-derived macrophages.
(A) Representative images of immunofluorescence staining of XRCC1 in monocytes differentiating into macrophages through GM-CSF treatment over a period of 6 days. (B) Quantification of the mean fluorescence signal of XRCC1. Each dot represents the fluorescence intensity of a single cell. (C) Representative images of the immunofluorescence staining of PAR in monocytes and monocytes that were differentiated into macrophages (at day 3). The control displayed no PAR signal whereas cells treated with 1 mM H2O2 for 5 min showed increased levels of PAR in macrophages on day 3 of differentiation. (D) Quantification of the mean fluorescence signal of PAR. Each dot represents the fluorescence intensity of a single cell. Data are from two independent experiments with at least 50 cells counted for each sample ± SEM, 1-way ANOVA, Tukey’s Multiple Comparison Test, ****p < 0.0001.

