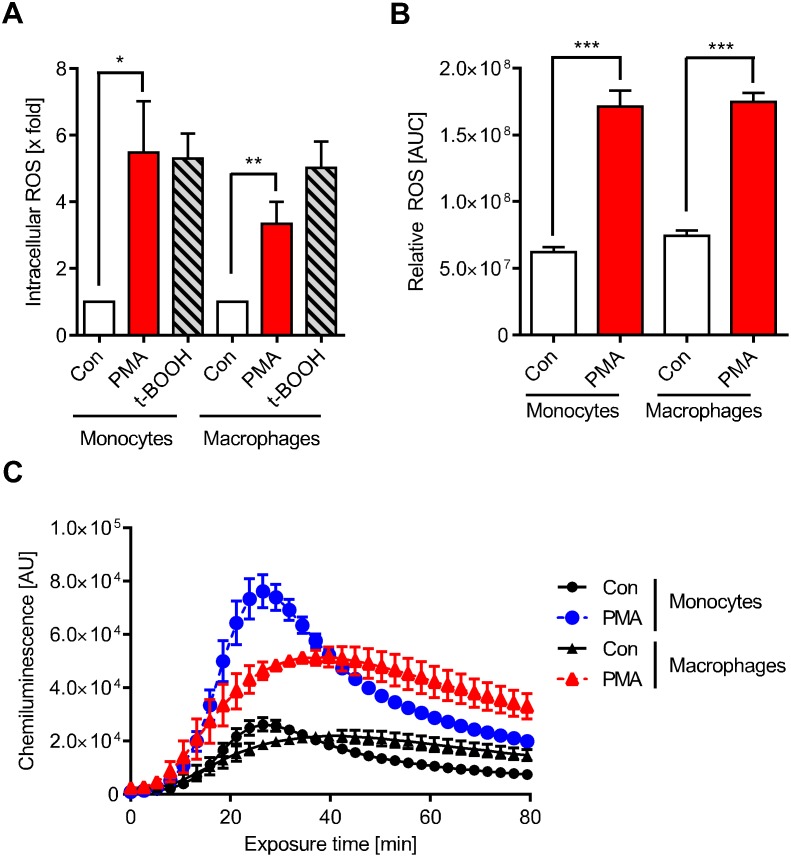
Fig 2. PMA-induced ROS formation.
(A) Cells were stained with 10 μM CM-H2DCFDA immediately before treatment with PMA or t-BOOH for 30 min. PMA triggered intracellular ROS production similar to the positive control t-BOOH. (B) Extracellular ROS produced by monocytes and macrophages following treatment with PMA was measured via chemiluminescence with luminol plus HRP and then quantified. (C) The extracellular ROS production of monocytes and macrophages measured over time showed different kinetics. PMA was added to the cells at zero time and chemiluminescence was measured thereafter as described. Data are the mean of at least three independent experiments ± SEM, 1-way ANOVA, Dunnett's Multiple Comparison Test, *p < 0.05, **p < 0.01, ***p < 0.001.

