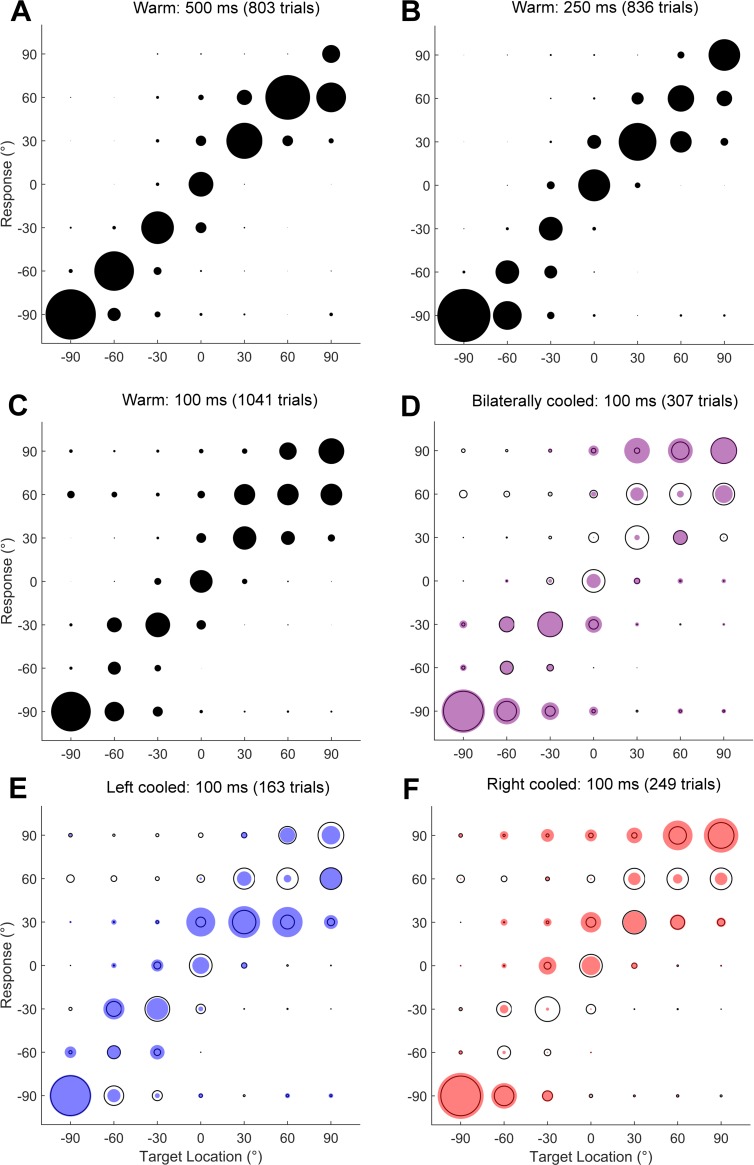
Fig 5. Sound localisation behaviour: an example ferret.
[A–C] Responses of one ferret (F1204) to auditory stimuli of 500, 250 and 100 ms duration with the distribution of responses made to sounds at each location indicated by the filled circles. [D–F] Responses of the same subject to 100 ms sounds presented during bilateral (purple) and unilateral (left or right, blue or red respectively) cooling. Data from control sessions [C] shown in black outline for comparison. Negative locations indicate angles to the left of the midline.

