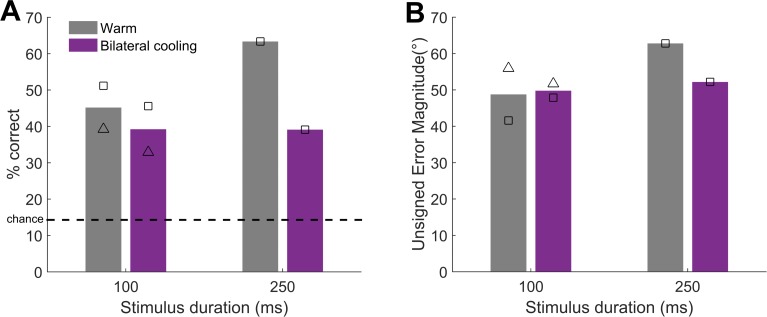
Fig 8. The effect of bilateral cooling on sound localisation performance.
[A] Bars show the mean performance across all locations tested for each stimulus duration for warm and bilaterally cooled conditions. [B] Bars show the mean unsigned error magnitude for each stimulus duration for warm and bilaterally cooled conditions. Symbols: F1204 = triangles, F1311 = squares.

