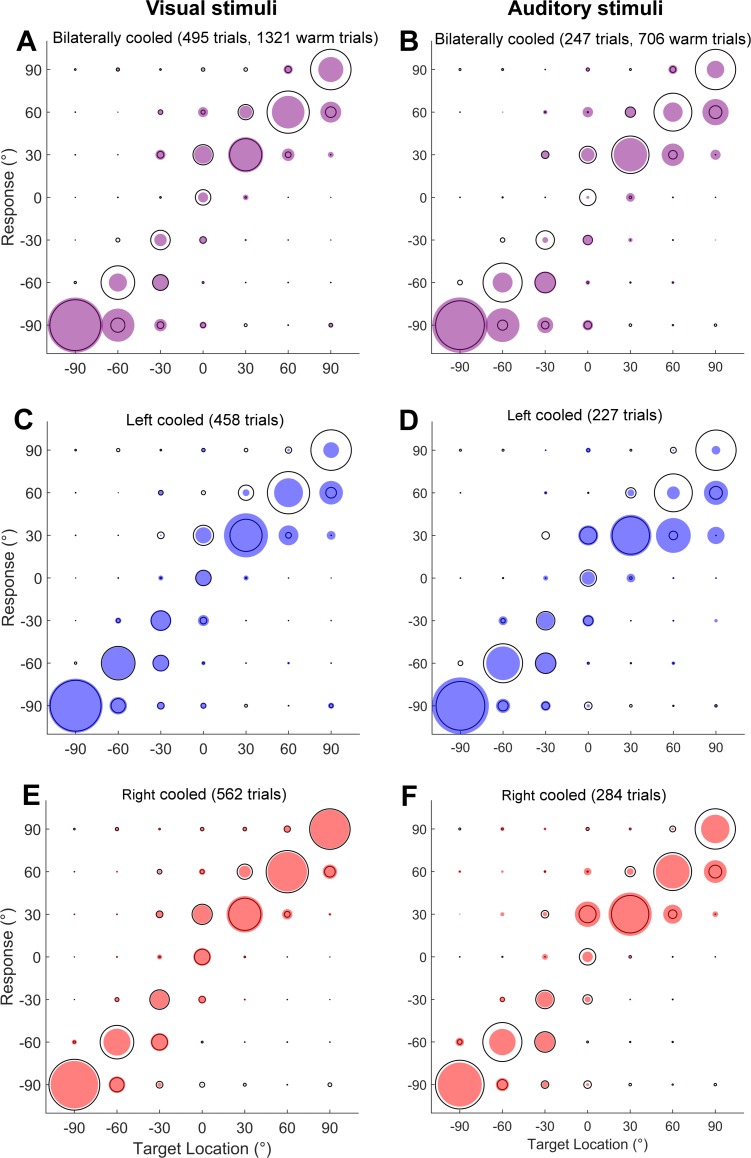
Fig 9. Comparison of the effects of cooling on visual and auditory localisation performance.
The responses of ferret F1311 to visual stimuli (left column) and matched difficulty auditory stimuli (right column) during bilateral (A & B), left (C & D) and right (E & F) unilateral cooling with the warm performance shown in grey for comparison. The distribution of responses made to sounds at each location is indicated by the filled circles.

