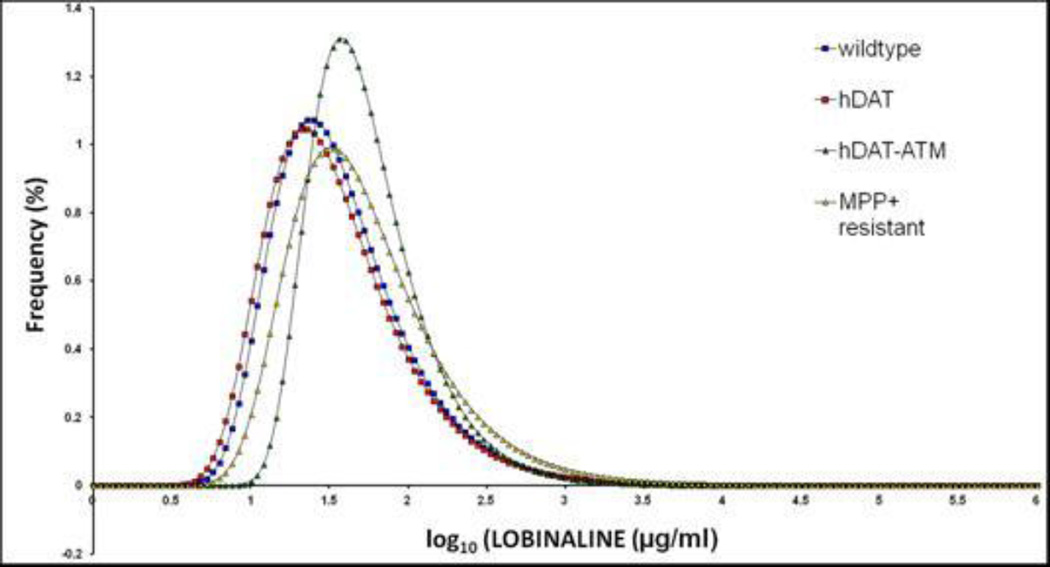
Figure 7. Frequency distribution of lobinaline concentrations in extracts from individuals in different sub-populations of hairy root cultures of L. cardinalis.
The Figure shows lobinaline concentration, determined by GC/MS in methanol extracts from individual cultures in the same populations shown in Figure 2. The same data presentation and statistical analysis was performed as for Figure 2. Means + SEM for lobinaline concentration are wildtype control (blue squares); 41.3±1.9 µg/ml; transgenic hDAT cultures (red squares) 38.3+1.8 µg/ml; non-selected transgenic hDAT ATM mutants (green triangles) 56.5+1.8µg/ml; MPP+-resistant transgenic hDAT mutants 59.2+2.5 µg/ml. One-way ANOVA followed by Bonferroni’s post-hoc analysis showed that extracts from the two mutant populations had a significantly greater lobinaline content from the control populations (P<0.001). The non-selected and MPP+-resistant mutants did not differ significantly from each other in means ± SEM, but the MPP+-resistant population included a higher proportion of individuals with a lobinaline concentration more than 3 SD above the control mean (37.9% vs 18.1%).

