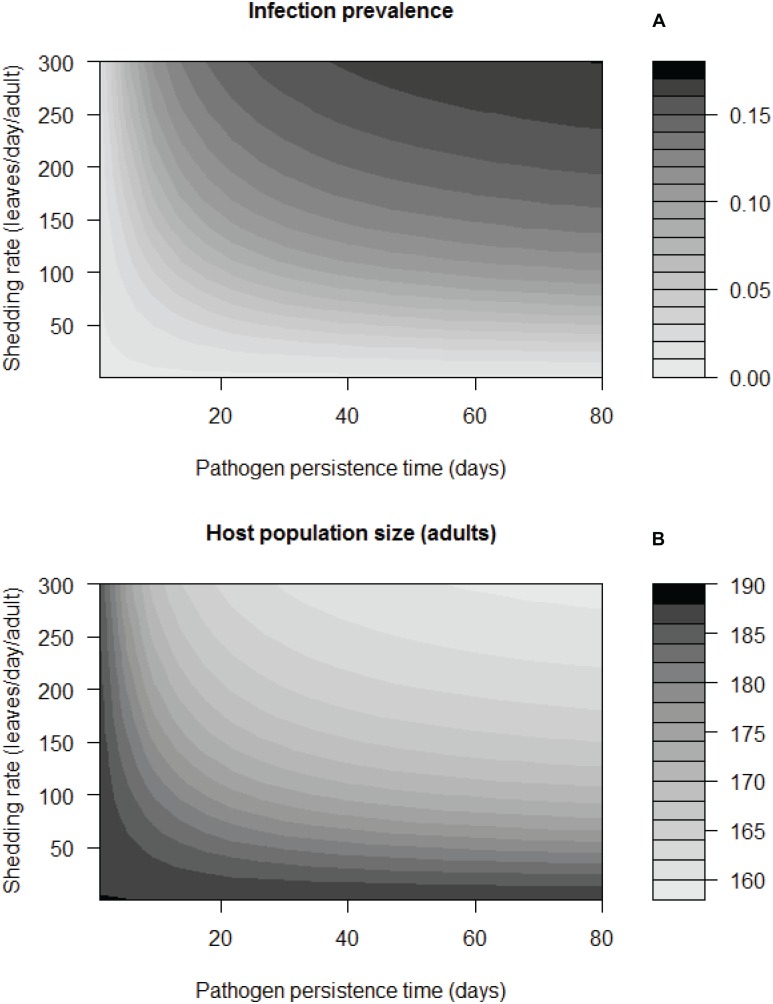
Fig 4. Parasite prevalence and host population size at the end of the season based on the transmission model, for a range of pathogen persistence times (1/μW) and shedding rates (λ).
Results from the model shown as heat contours for (a) infection prevalence at the end of the breeding season, and (b) adult monarch population size (T = 100 days; scale bars), depending on a range of pathogen persistence times and shedding rates.

